Governing water globally transforms crisis into opportunity through equity and sustainability.
Introduction: Transforming the world’s understanding of the economics of water
The hydrological cycle as a global common good
Towards a new economics of water
Pushing the economics: The case for shaping markets
Innovations to tackle water’s critical mission areas
Partnerships, property rights, and contracts for more water justice
Finance for a just and sustainable water future
The governance of water utilities
Harnessing data as a foundation for action
Opportunities for Just Global Water Governance
Water provides critical environmental functions and services that support all life. The Action Plan from the United Nations Water Conference in 1977 recognised water as a human right. It is also an essential input in economic activity, with no close substitute.
New assessments indicate a concerning global trend of near-universal water stress: few people reside and few cropped acres exist in locations that have no water-resource-related stresses.
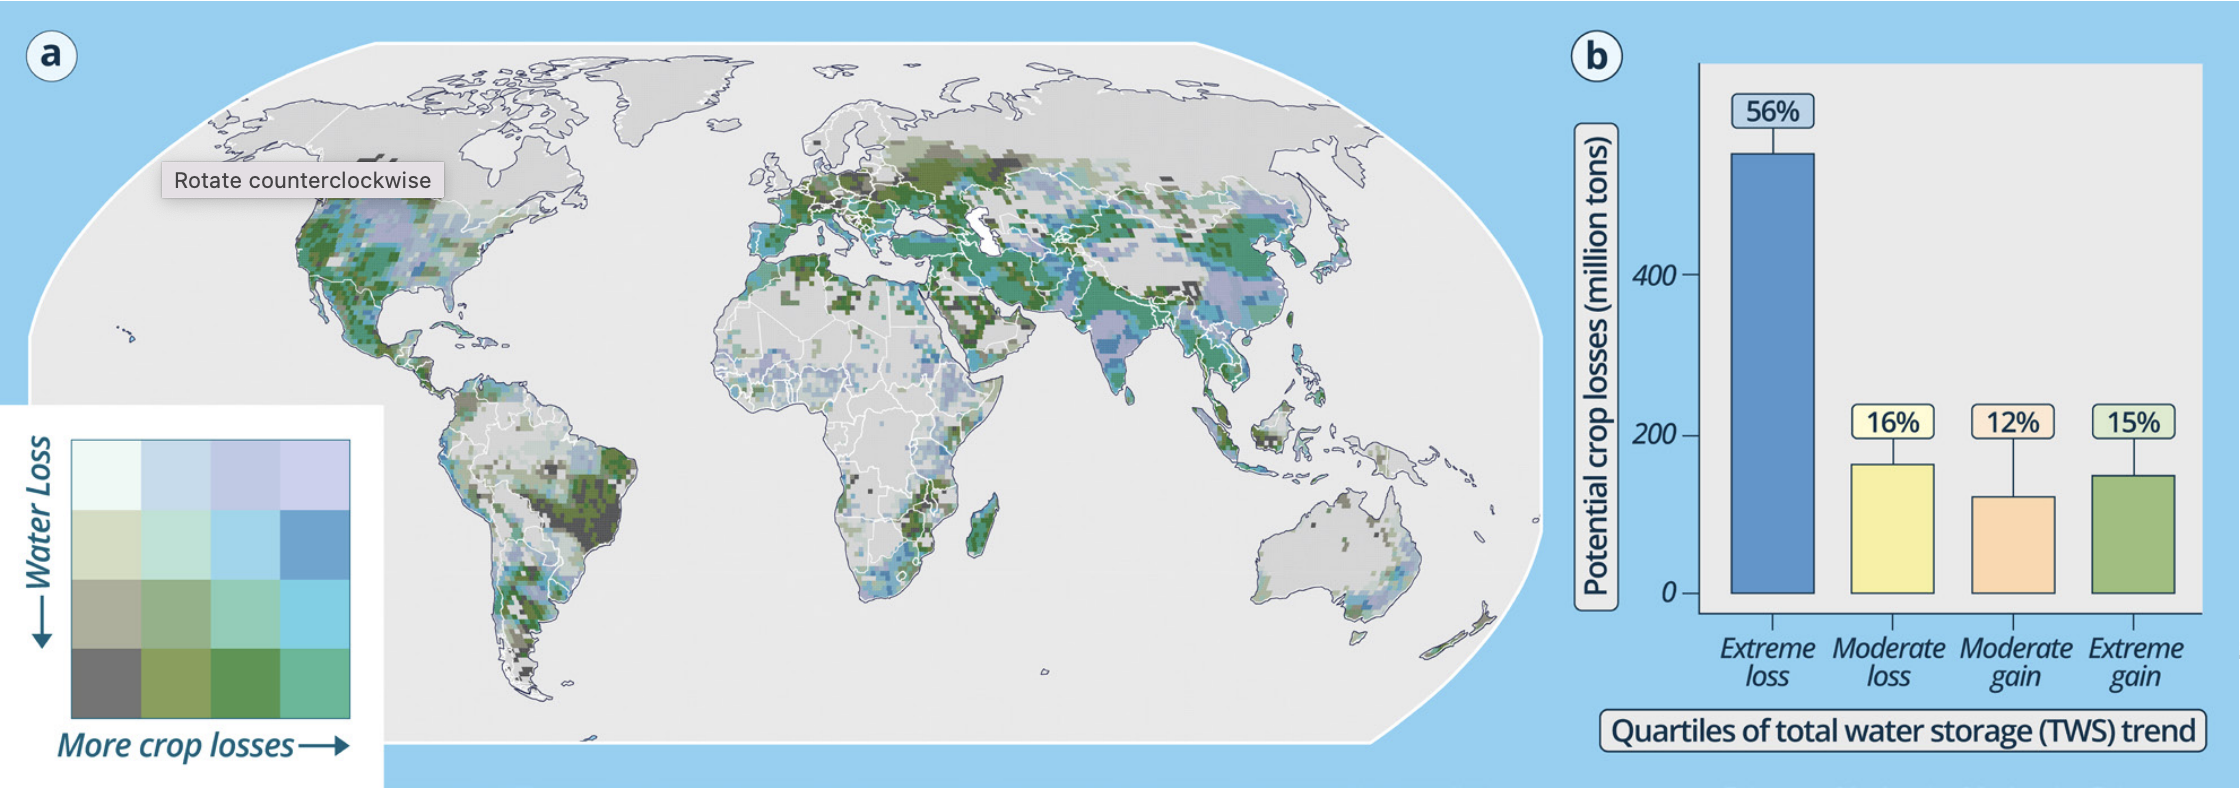
A significant portion of the global population (about 2.9 billion people) and 55% of the world’s food production are in areas experiencing drying or unstable trends in total water storage.
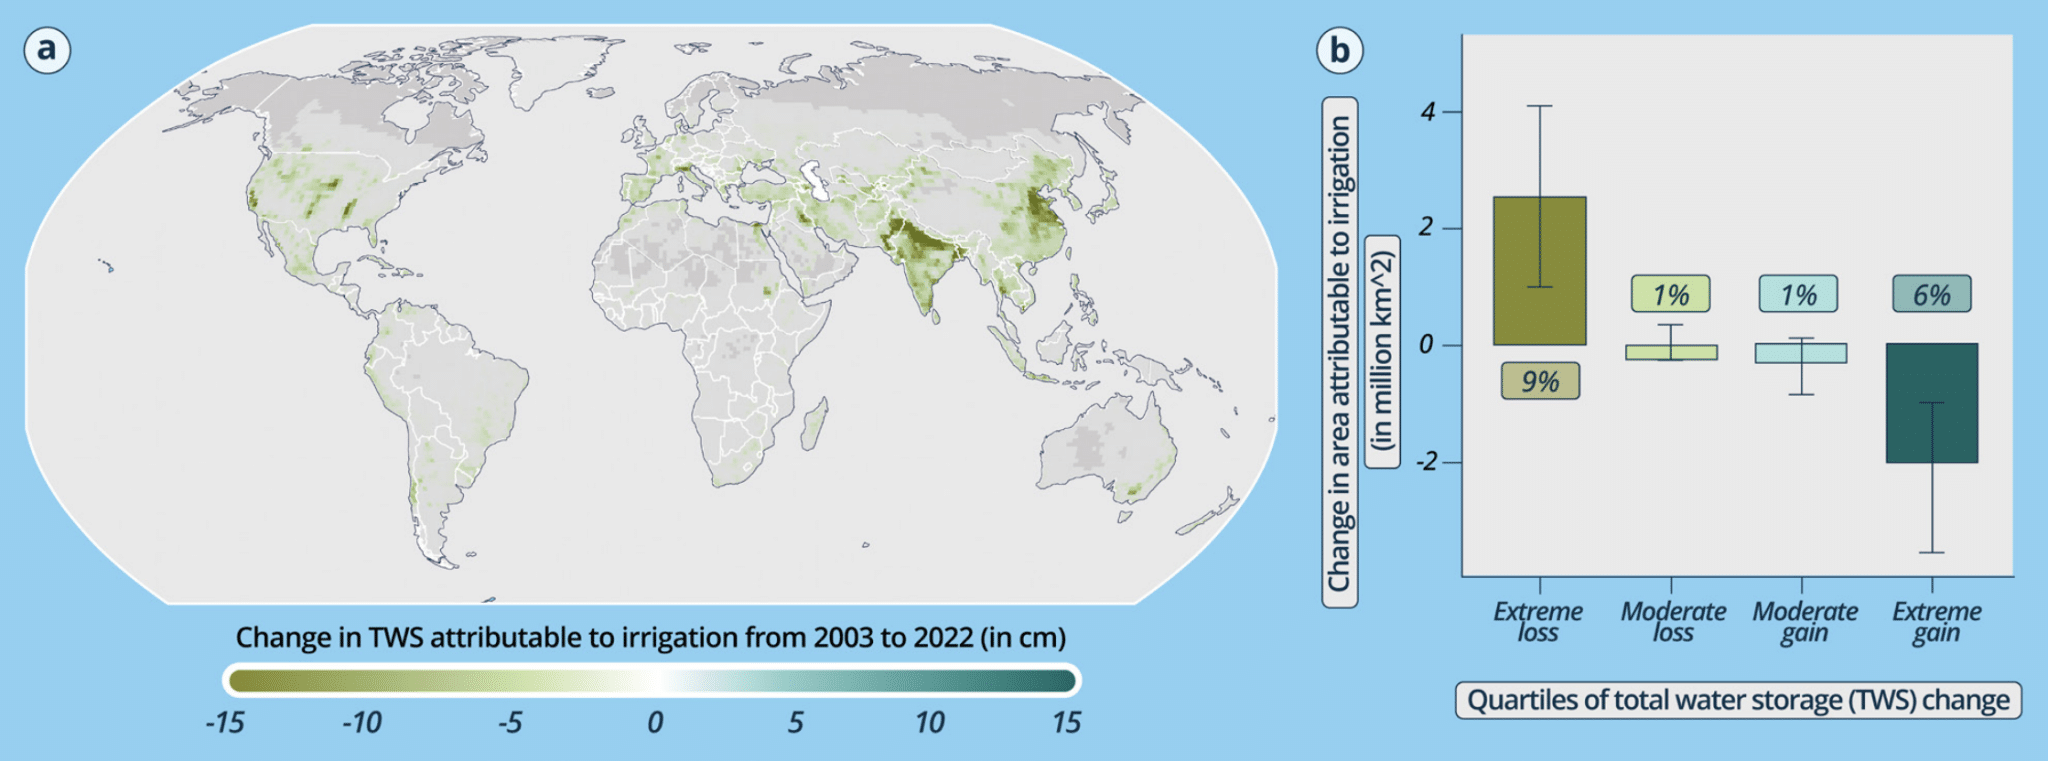
Where irrigation is prevalent, its drying impact overwhelms that of climate change. In some areas, the influence of irrigation on the drying trend is more than twice as strong as the climate effect.
Between 40% and 60% of terrestrial rainfall originates from land, with forest and natural ecosystems making significant contributions. Deforestation and other land-use changes disrupt these moisture flows, potentially exacerbating water scarcity in affected areas. These result in significant growth losses (0.5 – 0.7 percentage points) in affected areas, suggesting that the consequences of deforestation have been underestimated.
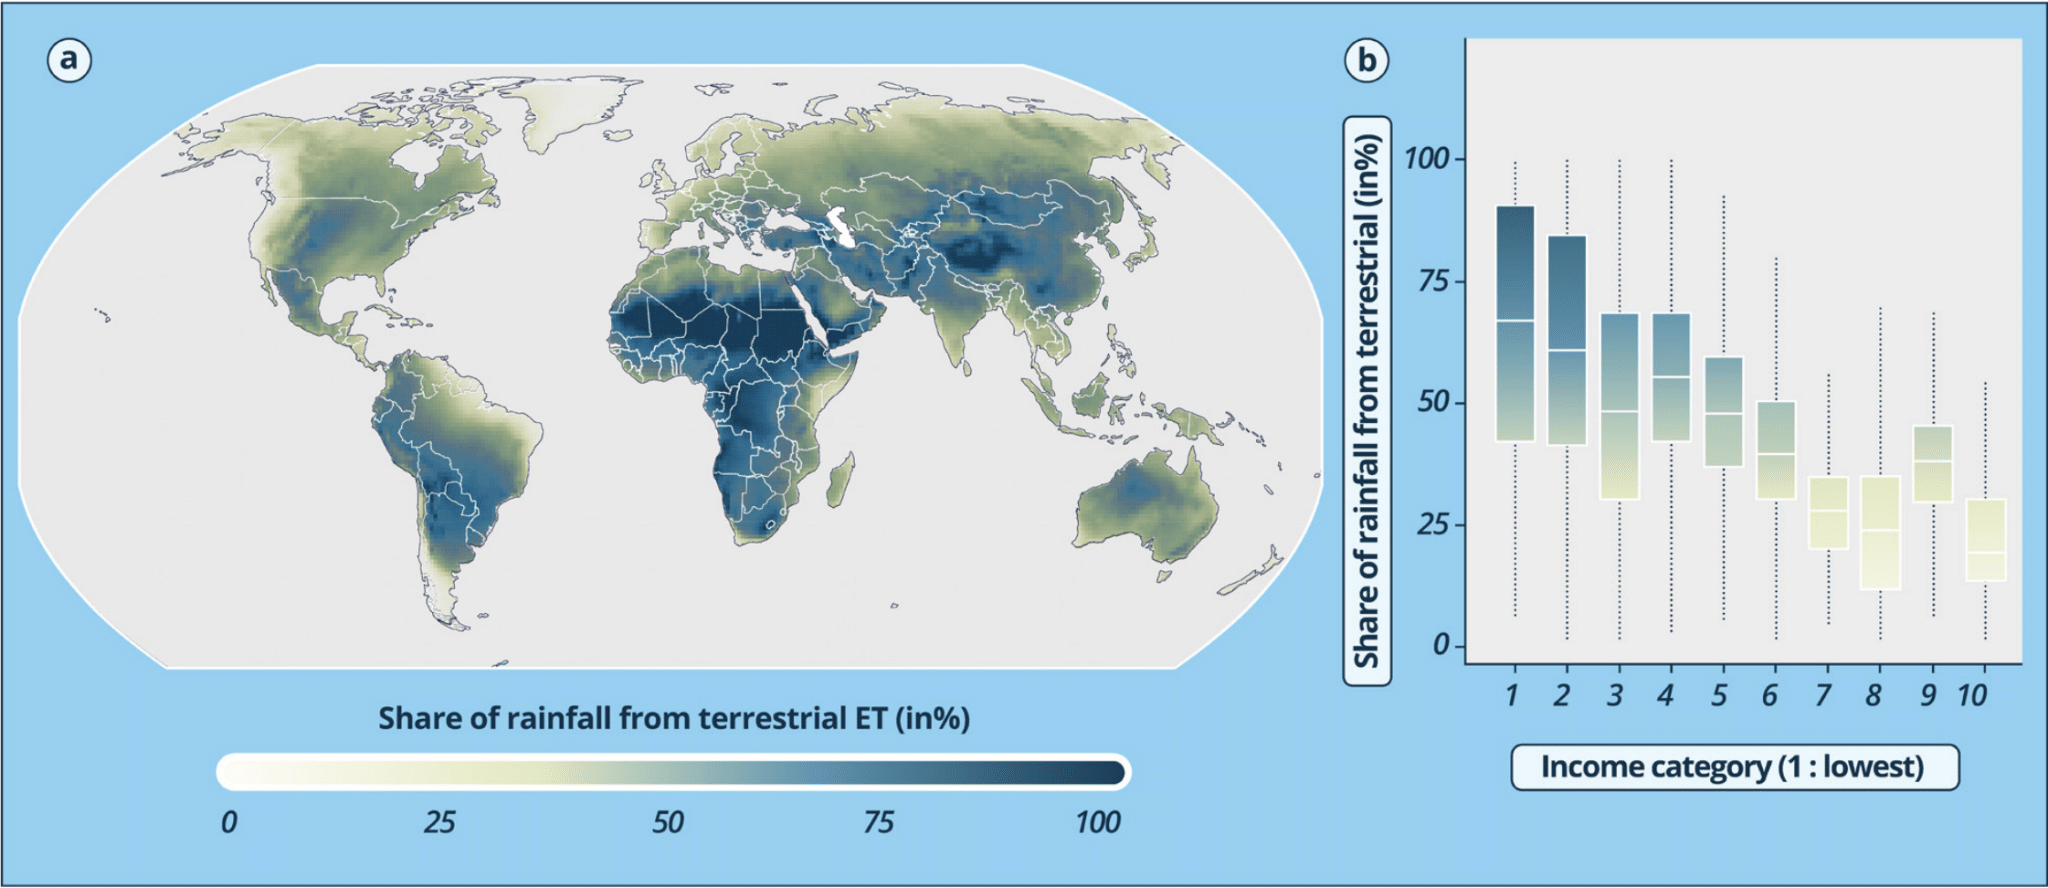
The poorest 10% of the global population reside in locations that receive 70% of their annual precipitation from land-based sources. Consequently, they are highly vulnerable to upwind land-use changes, over which they have little or no control.
While the supply of water is becoming less stable, demand is rising exponentially with increases in living standards and demographic change. Water withdrawals have increased at twice the rate of population growth in recent decades. Constraints on the supply of water translate into slower economic activity. New modelling suggests a high human toll under a business-as-usual scenario, including:
High-income countries are projected to experience a median 8% GDP decline, while lower-income countries could face a drop of 10-15%. These losses are larger than those projected by climate economic models that neglect the critical role of water.
The lack of access to safe water and sanitation exacerbates these economic impacts, disproportionately affecting poorer communities, women, and children
Virtual water exports are projected to decline, leading to a shift in export patterns. Water-stressed, lower-income countries heavily reliant on agriculture bear the brunt of these disruptions.
Agriculture consumes much of blue and green water globally, and has a disproportionate impact on the availability and sustainability of land and water resources. The magnitude of direct and indirect subsidies accruing to water users in agriculture is vast and likely exceeds USD 630 billion per year. Empirical estimates indicate that: (1) perverse subsidies distort cropping patterns and lead to water-intensive crops being grown in arid and semi-arid regions; (2) subsidies to forest-frontier products have promoted deforestation in the tropics; (3) nitrogen fertiliser subsidies are responsible for 17-20% of nitrogen pollution from runoff; and (4) such subsidies are regressive. Findings support a growing literature that highlights the unintended consequences of policies that neglect economic incentives.
Four dimensions of water call for a fundamental shift in the way that freshwater stresses are assessed and managed: (1) the public-good character of freshwater functions and services; (2) the interconnectedness of global change and local freshwater supply, and the resulting uncertainties; (3) the geographic interweaving of freshwater sourcing via atmospheric moisture flows; and (4) the increasing demand for freshwater due to rising living standards and population growth.
Water is often mismanaged due to perverse incentives and inappropriate policies. Policy incentives are seldom aligned with the economic, social, and environmental values that water services provide, while subsidies often encourage water-intensive industries to locate in regions where water is already scarce. When the supply of water is increased without corresponding incentives, demand rises to meet the new level of supply, resulting in a higher level of water dependence and inefficiency.
Model results illustrate that improving resource allocation – whether tariffs or other means – renders production and consumption activities more responsive to water scarcity and opportunity costs. These effects would ripple through the economy with positive feedback to water availability and long-term sustainability. Adjusting water tariffs to reflect externalities and scarcity to address market failures and scarcity constraints is pro-poor, benefiting water-stressed lower-income countries more than higher-income countries.
Sound water stewardship can go a long way towards mitigating the adverse effects of shifts in water availability in the face of climate change. Aligning economic incentives to reflect the value generated by green and blue water could yield a triple dividend:
Economic efficiency and resilience. Water-related impacts of climate change can be largely neutralised, improving climate resilience.
Equity. Economic benefits accrue mainly to the poor.
Environmental sustainability. Resource depletion is mitigated, safeguarding the environment.
As global populations rise and water supplies are disrupted by land-use change, the challenges will worsen, calling for urgent and bold reforms, and new policies that can address pressures of such scale and magnitude. Three overarching policy principles can lead the world to greater water security through efficiency, equity, and environmental sustainability.
Managing water stresses will require discouraging waste and allocating scarce water resources between sectors to obtain greater benefits. This could be achieved through infrastructure and regulation, or through better incentives such as pricing and trade. Any policy regime would need to include safeguards to assure access for poor households and environmentally sustainable and prudent uses.
Acknowledging that the economy is embedded in the biosphere, and that blue and green water systems are generally renewable but also finite, implies that there are absolute limits to the amount of water that can be safely and sustainably consumed. For blue water, this implies limits on the amount of water that can be withdrawn and on the concentration of pollutants in freshwater. For green water, this will mean protecting the sources of supply (forests and wetlands) with incentives and policies to conserve the moisture held in soils.
No single policy can achieve the multiple goals of efficiency, equity, and environmental sustainability. Policy packages will need to address the trade-offs that emerge. Complementary policies are needed to address distortions in related sectors that can stymie reform. For instance, subsidies to water-intensive industries would undermine the effectiveness of water prices in regulating demand. While these policy reforms will be demanding, the consequences of inaction will be far higher.
Why is managing water to promote well-being difficult? Water is a distinct natural resource that delivers multiple functions and services at multiple geographic scales. Being essential for survival, it was recognised as a human right by the Action Plan from the United Nations Water Conference in 1977. At its source, in rivers, forests, wetlands, and soils, it provides ecosystem services and functions that are public goods. These include ecological functions such as pollination, biomass growth, soil productivity, and maintaining the energy balance on Earth through the different states of water (liquid, ice, vapour). It is also an indispensable input to all economic activity, with no close substitute.
Given the wide range of functions and services provided by water, its management requires balancing the often-competing goals of economic efficiency, equity, and environmental sustainability while navigating difficult trade-offs.
With the rapid changes and imbalances occurring in Earth systems, economies must consider a new dimension of freshwater’s impacts on economic development: namely, changes in precipitation as the ultimate origin of all freshwater, be it blue water in rivers, lakes and groundwater, or green water in soils and as evapotranspiration through plants. Global environmental change, particularly land-use and climate change, are altering the hydrological cycle at all scales, from local to global, increasing uncertainty in the year-to-year supply of stable precipitation. This affects all regions of the world, from temperate-cold to arid-hot hydroclimates, and impacts all economic sectors. In addition, as pointed out in Chapter 2, 40-60% of precipitation on land originates from Land-to-Land supply, not from Ocean-to-Land supply, which means the performance of neighbouring, upwind economies is a core factor in managing green-water-supplying ecosystems as sources for atmospheric moisture flows and precipitation downwind. Adding to these challenges, while the supply of water is becoming less stable, demand for it is rising exponentially with increases in living standards and demographic change. Water withdrawals have increased at twice the rate of population growth in recent decades (Dinar, 2024).
Together, these four dimensions – (1) the public-good nature of freshwater functions and services at all scales, (2) the interconnectedness of global change and local freshwater supply, and the resulting uncertainties, (3) the geographic interweaving of freshwater sourcing via atmospheric moisture flows, and (4) the increasing demand for freshwater – call for a fundamental shift in the way freshwater stresses are assessed and managed.
Current water policies are not designed to address pressures of such scale and magnitude, and often inadvertently exacerbate the degradation of water resources. Policies seldom allocate water in ways that reflect the types of value it creates, while subsidies often encourage water-intensive industries to locate in regions where water is already scarce. Nor have costly investments in water storage and infrastructure provided lasting relief. When the supply of water is increased without corresponding incentives, demand rises to meet the new level of supply, resulting in a higher level of water dependence and inefficiency. Powerful economic forces have transformed well-intentioned policies, into documented failures.
Adjusting to the new realities will call for significant reforms built on three overarching principles: the need to (1) value water for the critical economic, environmental, and social services it provides; (2) establish absolute limits to the amount of water that can be used safely and sustainably; and (3) implement policy packages to address trade-offs and achieve the triple goals of economic efficiency, equity, and environmental sustainability.
Translating these principles into effective policies will be challenging. It will be necessary to first identify where water-related risks and hotspots are most severe, then to understand what drives these changes – natural forces such as temperature and rainfall, or profligate management practices – and finally to assess the costs of inaction to determine whether reforms and changes that entail trade-offs are warranted. This chapter provides information to help answer these questions.
The first part of the chapter explores the effects of blue and green water on well-being, providing new estimates of the incidence and magnitude of impacts. It focuses on the economic significance of atmospheric moisture flows, since their contribution is not known despite accounting for 40-60% of rainfall. The second part of the chapter deals with blue water management and outlines the broad contours of a policy approach to achieve greater efficiency, equity, and environmental sustainability.
Drawing upon the analysis in Chapter 2, which identified prominent markers of water stress – declining total water storage (TWS), aridity and groundwater depletion – this section explores the intersection between water-related stresses and socioeconomic factors and vulnerabilities.
The socioeconomic impacts of water scarcity are likely to be more severe in places where high demand and vulnerable populations converge. Demand for water is typically higher in densely populated regions and those where agriculture is the primary economic activity. Vulnerable populations, identified using the Human Development Index (HDI) as a proxy, have low income and limited human capital, and are known to be more vulnerable to exogenous shocks and stresses. While rigorous research on the socioeconomic impacts of growing water scarcity is limited, evidence suggests that vulnerable populations struggle to adapt to growing water scarcity and often abandon farming or migrate (Fishman et al., 2024; Zaveri et al., 2021).
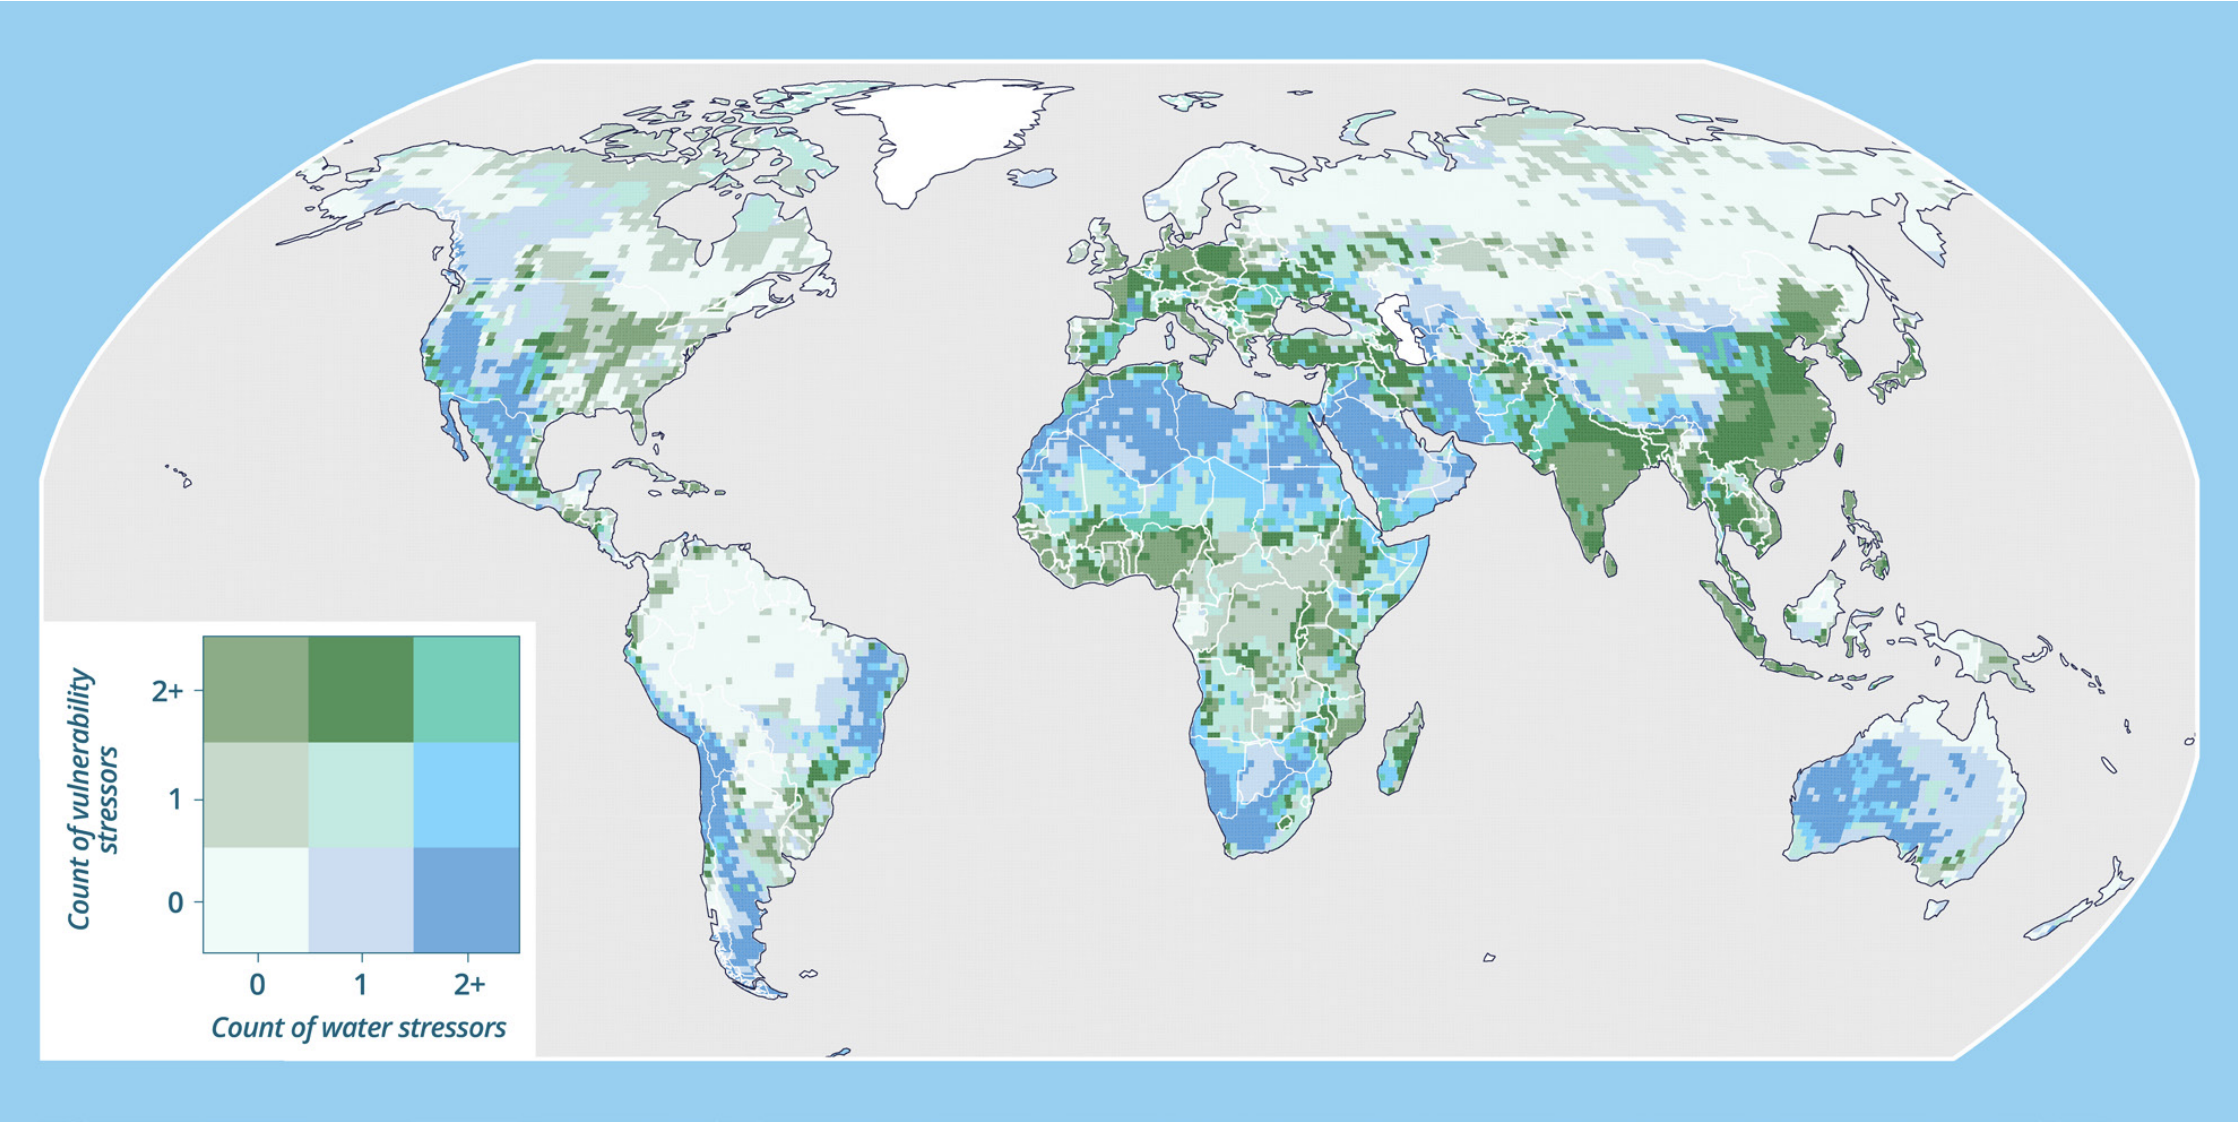
A region is more likely to endure some level of water risk if it is exposed to at least one supply-side stress factor (such as aridity, or declining total water storage or groundwater scarcity) or one demand-side stress factor (such as high population or cropped area, or a low HDI score). Figure 3.1 shows that relatively few people live and little cropland is cultivated or irrigated where there are no water related stresses. It reveals:
There are severe water challenges in northwestern India and parts of northeastern China, where water stress, demand, and socioeconomic vulnerability are all high.
Large regions of the United States, Middle East, and Australia face water stress, but relatively low socioeconomic vulnerability. Nevertheless, if food supplies are adversely impacted, resulting in higher prices, there could be spillover effects to other, more-vulnerable regions.
Regions where water stress is low, tend to have comparatively lower population densities and lower levels of crop cultivation, reflecting limited demand for water.
A notable exception emerges in some areas of central Africa, where poverty is high and the HDI is low, but total water storage is increasing over time. These present an opportunity for sustainable agricultural expansion (see Box 3.1) for some of the most disadvantaged populations.
Note: The map shows the combined vulnerability and water stressors in each region. Vulnerability stressors include: (1) being in the highest quartile of the global population distribution; (2) being in the lowest quartile of the global HDI distribution; (3) being in the highest quartile of the global cropped area distribution; and (4) being in the highest quartile of the global irrigated cereal production distribution. Water stressors include (1) being in the lowest (fastest-depleting) quartile of total water storage; (2) being in the lowest quartile of groundwater depth; and (3) being in the lowest quartile of global aridity distribution.
Notes: (a) The map shows trends in total water storage (TWS) against potential cereal production losses if the land would no longer be irrigated. Potential cereal production losses are estimated from FAO-GAEZ data by calculating the difference between irrigated potential production and rainfed potential production in currently irrigated areas for wheat, rice, sorghum, millet, maize, and barley. Regions in white are those in which irrigation is currently absent. (b) The bar plot shows the distribution of all current cereal production gains derived from irrigation across the quartiles of the global TWS trend distribution. Quartile 1 (extreme loss) contains TWS trends below -0.40 cm per year, Quartile 2 (moderate loss) between -0.4 to -0.04 cm per year, Quartile 3 (moderate gain) between -0.04 and +0.30 cm per year and Quartile 4 (greatest extreme gain) above 0.30 cm per year. Greatest or extreme loss is defined as the lowest quartile of the distribution, with TWS trends below -0.40 cm per year. Trends in TWS are recovered from GRACE and reported in prior work. These show that annual changes can be small compared to average precipitation. The Appendix shows that these effects become more severe with climate change and that year-on-year impacts compound over time. It is shown that 38% of the population lives in the 25% of cells losing water fastest. If these losses persist, the compound impacts would be a concern. Together, these results show that just 31% of the population are in regions where water resources are stable.
Agricultural productivity in sub-Saharan Africa is critical to addressing poverty and providing food security. The gap between potential and actual crop yield is notably wide in Africa largely driven by low land and labour productivity. Much of the output increase achieved in recent years has come about through extensification, or the expansion of agricultural land into marginal lands and bringing forest areas under cultivation. This approach is not sustainable with growing populations and degrading soils.
Irrigation levels in Africa are low and below their sustainable potential (Rosa et al., 2020). Most policymakers and much of the literature reflexively assume that increases in irrigation will entail increasing surface water storage in large lakes or dams, such as Lake Nasser and the Grand Ethiopian Renaissance Dam. These call for significant investments that are difficult to finance in low-income countries, and that have adverse environmental consequences and debilitating social impacts from the submergence of productive land, displacement of vulnerable populations, loss of biodiversity and release of methane emissions from rotting reservoir vegetation.
However, recent satellite data shows a more benign and cost-effective alternative is available. Groundwater in some parts of Africa is a vast, untapped resource. The annual groundwater recharge (1,500 km3) is estimated by Scanlon et al. (2022) as equivalent to the combined annual flow of all the major rivers of Africa: the Congo, Nile, Niger, and Zambezi. Another positive feature of Africa’s aquifers is that recharge rates correlate inversely to storage capacity (McDonald et al., 2021). Hence, rapid recharge of shallow aquifers provides an opportunity for higher sustainable abstraction rates, while large storage capacity in deep aquifers can provide a buffer for times of stress.
Groundwater can therefore be a cost-effective and environmentally attractive way to manage water scarcity and rainfall variability, and boost productivity if it is managed for efficiency and sustainability and considers the needs of groundwater dependent ecosystems and the services they provide. With the increasing availability of cheap, solar-powered pumps, there is an opportunity to invest in systems that tap into Africa’s groundwater resource to buffer against rainfall variability and increase yields.
There is an important caveat. Africa can learn and improve upon experiences elsewhere, and utilise new monitoring technologies and information to ramp up production without depleting and polluting its aquifers or degrading its groundwater-dependent ecosystems. But this will require different natural resource management systems. Despite rapid urbanisation, rural agricultural water demands will rise further, highlighting the need for systemic reforms.
Understanding what drives changes in total water storage is essential to addressing the risks of hydrological imbalances. If climate change is the main culprit, it would call for a focus on climate adaptation strategies. Conversely, if drying trends are a consequence of irrigated agriculture, this underscores the need for improved water resource management in agriculture. Identifying the role of agriculture is important as it accounts for 80-90% of blue water consumption (Hoekstra & Mekonnen, 2012; D’Odorico et al., 2019) and is a major contributor to ecosystem degradation and tropical deforestation. 2This subsection provides initial insights into the drivers of total water storage changes, acknowledging the limitations of the data and climate uncertainty. Methodological details are provided in Appendix 3.2.3
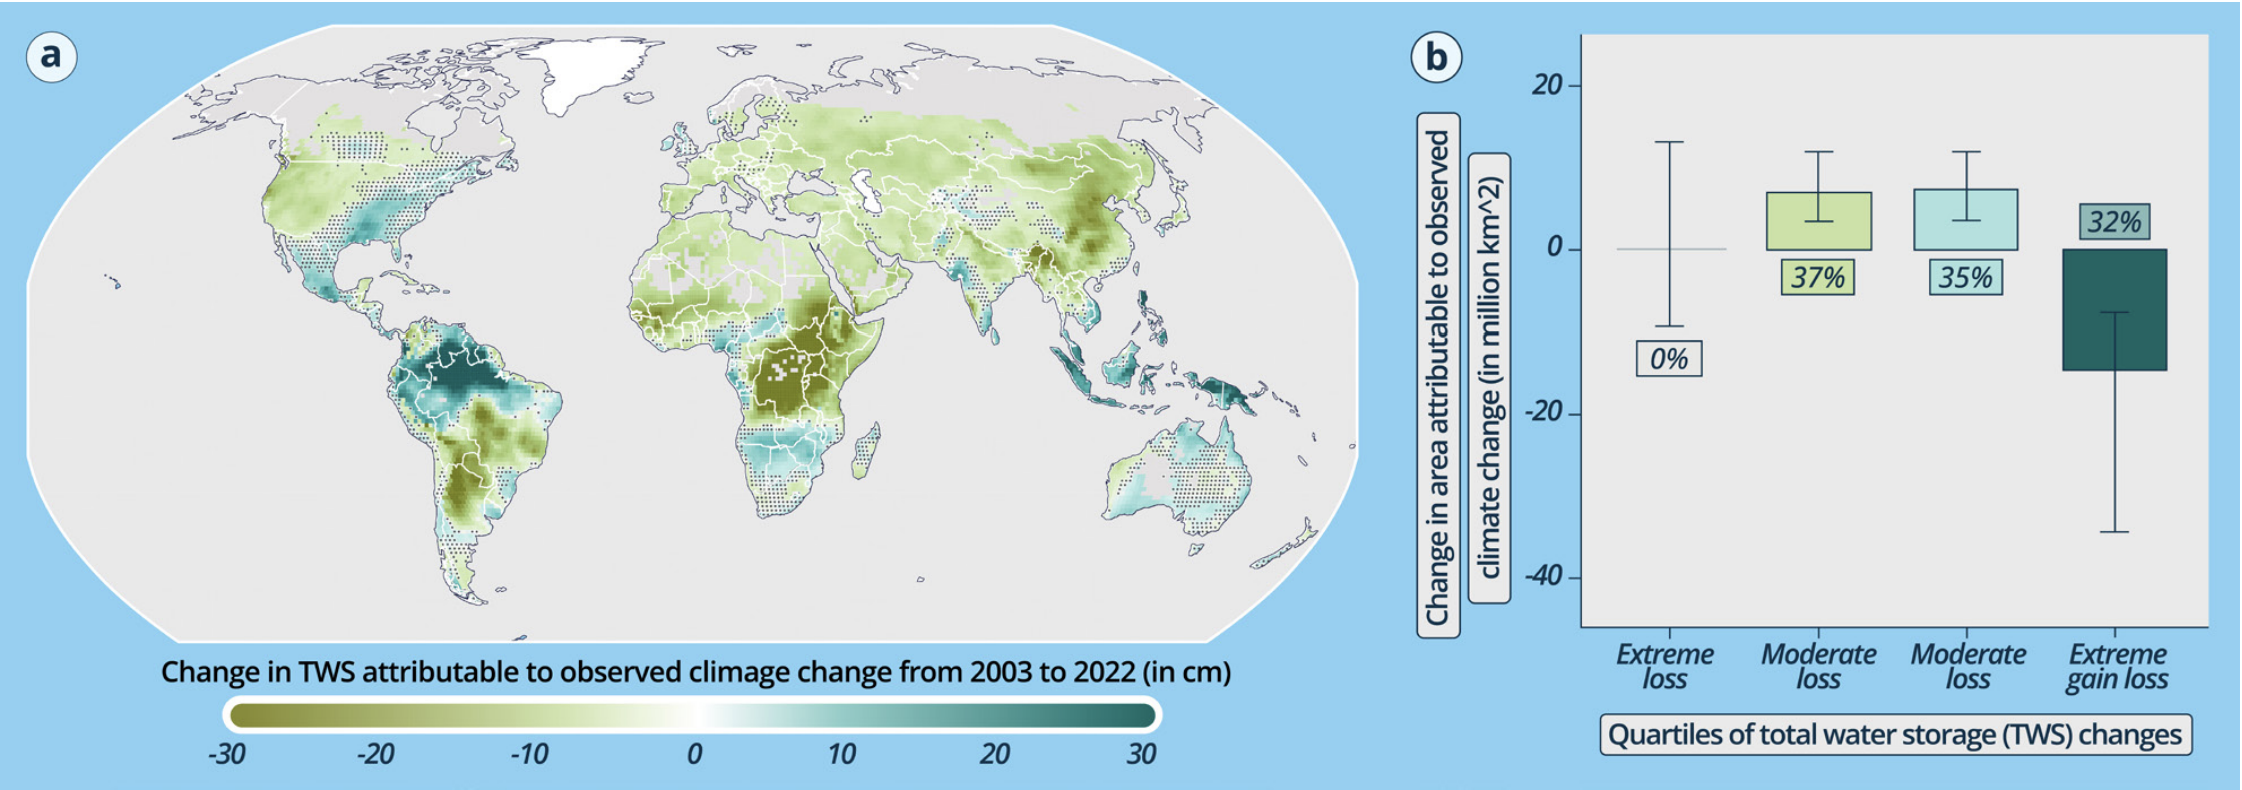
Figure 3.3 shows the combined effects of temperature and precipitation trends over 2003-22. Observed warming trends have significantly accelerated water loss in most regions. However, increased precipitation in some locations has mitigated this. On average, a decline of 1 cm in annual precipitation is estimated to accelerate water loss by around 0.04 cm per year (95% CI: 0.02-0.05 cm per year).4 This finding is based on regression analysis and is consistent with previous estimates showing that changes in total water storage are smaller than fluctuations in precipitation. Appendix 3.3 Figure A2 provides a global decomposition of these effects into those driven by temperature versus precipitation.
2 Note that while other human activities such as energy cooling systems and mining withdraw substantial amounts of water, these generally return water directly to the local environment. In contrast, crops evapotranspire withdrawn water, generating true local losses in water storage.
3 Overall, this assessment indicates that recently observed trends in temperature and precipitation have had spatially variable impacts on total water storage. Observed warming trends have significantly accelerated water loss in almost all regions of the world, with few exceptions. On average, every 1°C of additional warming is estimated to accelerate rates of water loss by -0.3 cm per year (95% CI: 0.14-0.62 cm per year).3 As a result, observed warming over 2003-22 is estimated to have increased the share of arable land experiencing net total water storage loss by 53% (95% CI: 21-136%). In some locations, heterogenous variations in rainfall have ameliorated these drying trends.3 On average, a decline of 1 cm in annual precipitation is estimated to accelerate water loss by around 0.04 cm per year (95% CI: 0.02-0.05 cm per year).3
4The estimated effect represents the average treatment effect of precipitation on total water storage for the globe.
Notes: (a) Changes in total water storage (TWS) attributable to climatic change are derived by combining observed changes in the climate obtained from the ERA5 reanalysis dataset with statistical estimates of the TWS-temperature and TWS-precipitation associations (Appendix 2). Regions in grey have no arable land. Stippling indicates where impacts of observed climate change are not statistically distinguishable from zero, using a 95% confidence interval derived from block bootstrapping. (b) The bar plot shows changes in the arable land exposed to each quartile of the observed TWS change distribution that have occurred because of observed temperature and precipitation trends, relative to a counterfactual scenario with the 1951-70 climate. Quartile 1 (extreme loss) contains TWS trends below -0.40 cm per year, Quartile 2 (moderate loss) between -0.4 to -0.04 cm per year, Quartile 3 (moderate gain) between -0.04 and +0.30 cm per year, and Quartile 4 (extreme gain) above 0.30 cm per year. Whiskers indicate 95% confidence intervals obtained through bootstrapping.
Where irrigation is prevalent, it dominates the effects of temperature and precipitation. On average, fully irrigated locations lose around 1.6 cm (95% CI: 0.72-2.87 cm) more water storage per year than unirrigated regions. 5This is about 58% greater than the loss in locations with the most rapid (lowest quartile) total water storage depletion due to climate change. The effect is similar in magnitude to that of 5 degrees warming. Figure 3.4 displays changes in total water storage attributable to irrigation. In northwest India and northeast China, the historical effect of irrigation on water storage was on average twice that of the estimated effect of climate change. Overall, irrigation has increased the global share of arable land experiencing extreme water loss by 9% (95% CI: 4-16%).
Notes: (a) Changes in total water storage (TWS) attributable to irrigation are derived by combining data on the average area equipped for irrigation in 2000-15 with an estimate of the TWS-irrigation association (see Appendix 2 for details). Regions in grey have no arable land. Stippling indicates where impacts of observed irrigation are not statistically distinguishable from zero, using a 95% confidence interval derived from block bootstrapping. (b) The bar plot shows changes in the arable land exposed to each quartile of the observed TWS change distribution that have occurred because of irrigation, relative to a counterfactual scenario without irrigation. Quartile 1 (extreme loss) contains TWS trends below -0.40 cm per year, Quartile 2 (moderate loss) between -0.4 to -0.04 cm per year, Quartile 3 (moderate gain) between -0.04 and +0.30 cm per year, and Quartile 4 (extreme gain) above 0.30 cm per year. Whiskers indicate 95% confidence intervals obtained through bootstrapping.
Since the analysis is based on Gravity Recovery and Climate Experiment (GRACE) grid cells that are large (around 110 km per side), it is not possible to assess whether drying in one location has impacts upon the wider landscape. Nevertheless, the results are consistent, with irrigation outflows exceeding inflows to the system. In policy terms, this suggests the need to improve efficiency and relocate production, especially where climate change is likely to increase rates of water loss.
These findings support a growing literature that highlights the unintended consequences of policies that neglect economic incentives. When irrigation water is supplied for free or at a subsidised price, it signals that water is abundant and farmers respond by irrigating beyond sustainable limits.
Land-use change significantly influences precipitation patterns across regions (Keys et al., 2019). About 40-60% of rainfall over land originates from land-based evapotranspiration – known as terrestrial moisture recycling (TMR) – much of which comes from forests, cropland, and large water bodies (De Petrillo et al., 2024). This creates a complex, global web of influence between land use and rainfall. However, little is known about the economic significance of these links. This section provides an initial assessment of the economic contribution of terrestrial moisture recycling.
The assessment suggests that large shares of the global poor and of rainfed agricultural lands are reliant on precipitation originating from terrestrial moisture recycling (Figure 3.5). A striking finding is that the poorest decile of the global population receives nearly 70% of its annual precipitation from terrestrial moisture recycling. In contrast the richest decile obtain only around 20% of rainfall from terrestrial sources. Further, regions that generate a substantial amount of terrestrial-moisture-recycling-driven rainfall in poorer areas coincide with deforestation hotspots, placing them at greater risk of precipitation declines as described in appendix (Harris et al., 2017).
Notes: (a) The map shows the share of total rainfall in each region that originates from terrestrial evapotranspiration (ET), as derived from the Utrack model (Tuinenburg & Staal, 2020) in combination with ERA5 precipitation data (Appendix 1). Darker blue indicates that more rainfall originates from land-based moisture flows (i.e., greater dependence on terrestrial moisture recycling). (b) The plot shows the average share of total rainfall sourced from terrestrial evapotranspiration for regions in each decile of the global income distribution. Regions are divided into income categories using GDP data from Kummu et al. (2018).
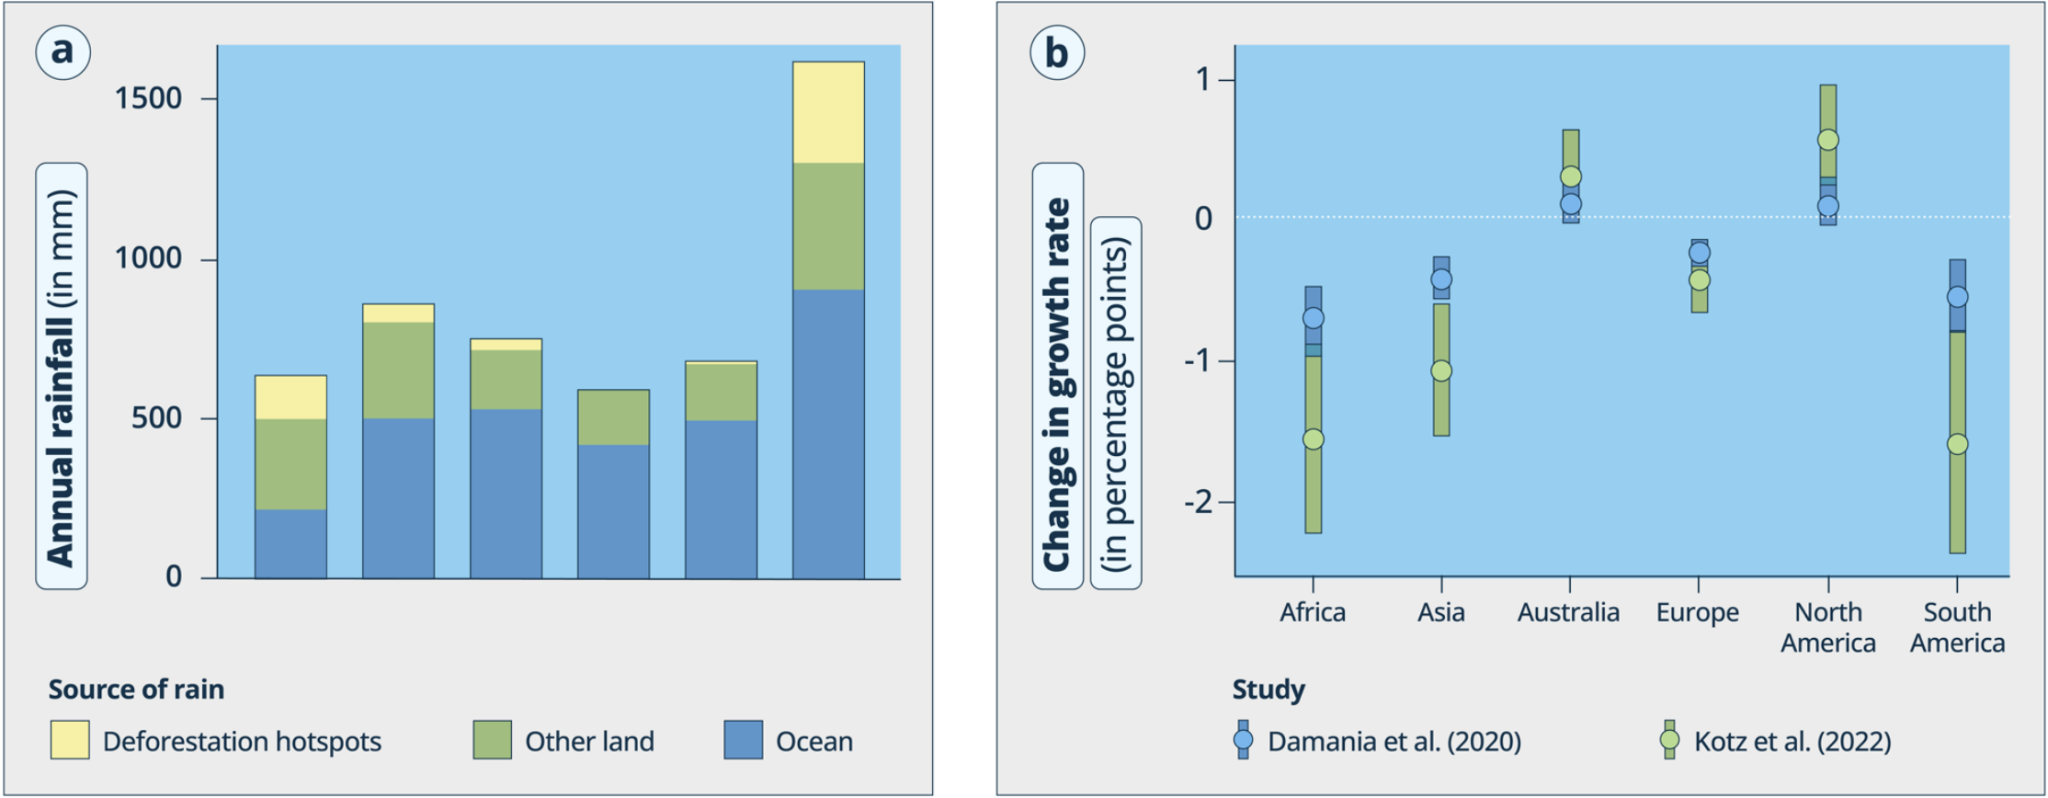
Figure 3.6 illustrates that the elimination of all TMR flows in Africa and South America would result in a fall in gross domestic product (GDP) growth of 0.5 (95% CI: -0.28, -0.69) and 0.7 (95% CI: -0.38, -1.04) percentage points per year, respectively (Appendix 2.3). Agricultural output would be similarly impacted, with declines in growth in these regions estimated at 0.7 (95% CI: -4.65, 0) and 0.6 (95% CI: 2.58,0.28), respectively. Given that long-term global economic growth averages around 3.8% a year in Africa and 1.9% in South America, these declines represent a significant impediment to progress. The estimates suggest that the marginal losses from TMR-related rainfall reductions are nonlinear and generally more pronounced where rainfall is low and economic activity depends heavily on precipitation.
A caveat should be noted: the empirical estimates used to derive these projections are statistically determined short-term responses in GDP and agricultural output growth to rainfall variations. The longer-term effect of a permanent reduction in terrestrial moisture recycling could be weakened or enhanced through economic adjustments. Nevertheless, the findings imply that terrestrial moisture recycling is a materially important input to the economy. Estimates of the economic contribution of forests have neglected this important ecosystem service and thus severely underestimate the economic value of forests.
Notes: (a) The bar chart shows the breakdown of precipitation by source-type aggregated by continent. Deforestation hotspots are as identified by Harris et al. (2017), aggregated by continent. (b) The plot shows the estimated average change in GDP growth rates from removing all terrestrial precipitation (green and brown segments of bars). (Appendix figure A6 shows the analogous estimates from removing terrestrial precipitation only from deforestation hotspots). Changes are calculated using estimates of the impact of precipitation shocks on economic growth from Kotz et al. (2022) in gold and Damania et al. (2020) in grey. Dots indicate the point estimates, while error bars indicate statistical uncertainty in the GDP growth rate change estimates using 95% confidence intervals obtained through block bootstrapping (Appendix 2).
The growth impacts in Figure 3.6 are based on new econometric estimates linking aggregate economic and agricultural (crop and livestock commodities) output to changes in precipitation. These are used to conduct simulation exercises evaluating the impacts that various future land-use scenarios might have on terrestrial moisture recycling. This is a partial-equilibrium calculation best interpreted as a short-term effect that will induce further economic adjustments. It provides the first global estimate of the magnitude of economic benefits generated by terrestrial moisture recycling. In a second step, these results can be assessed in a computable general equilibrium model that would allow for economic adjustments to changing conditions.
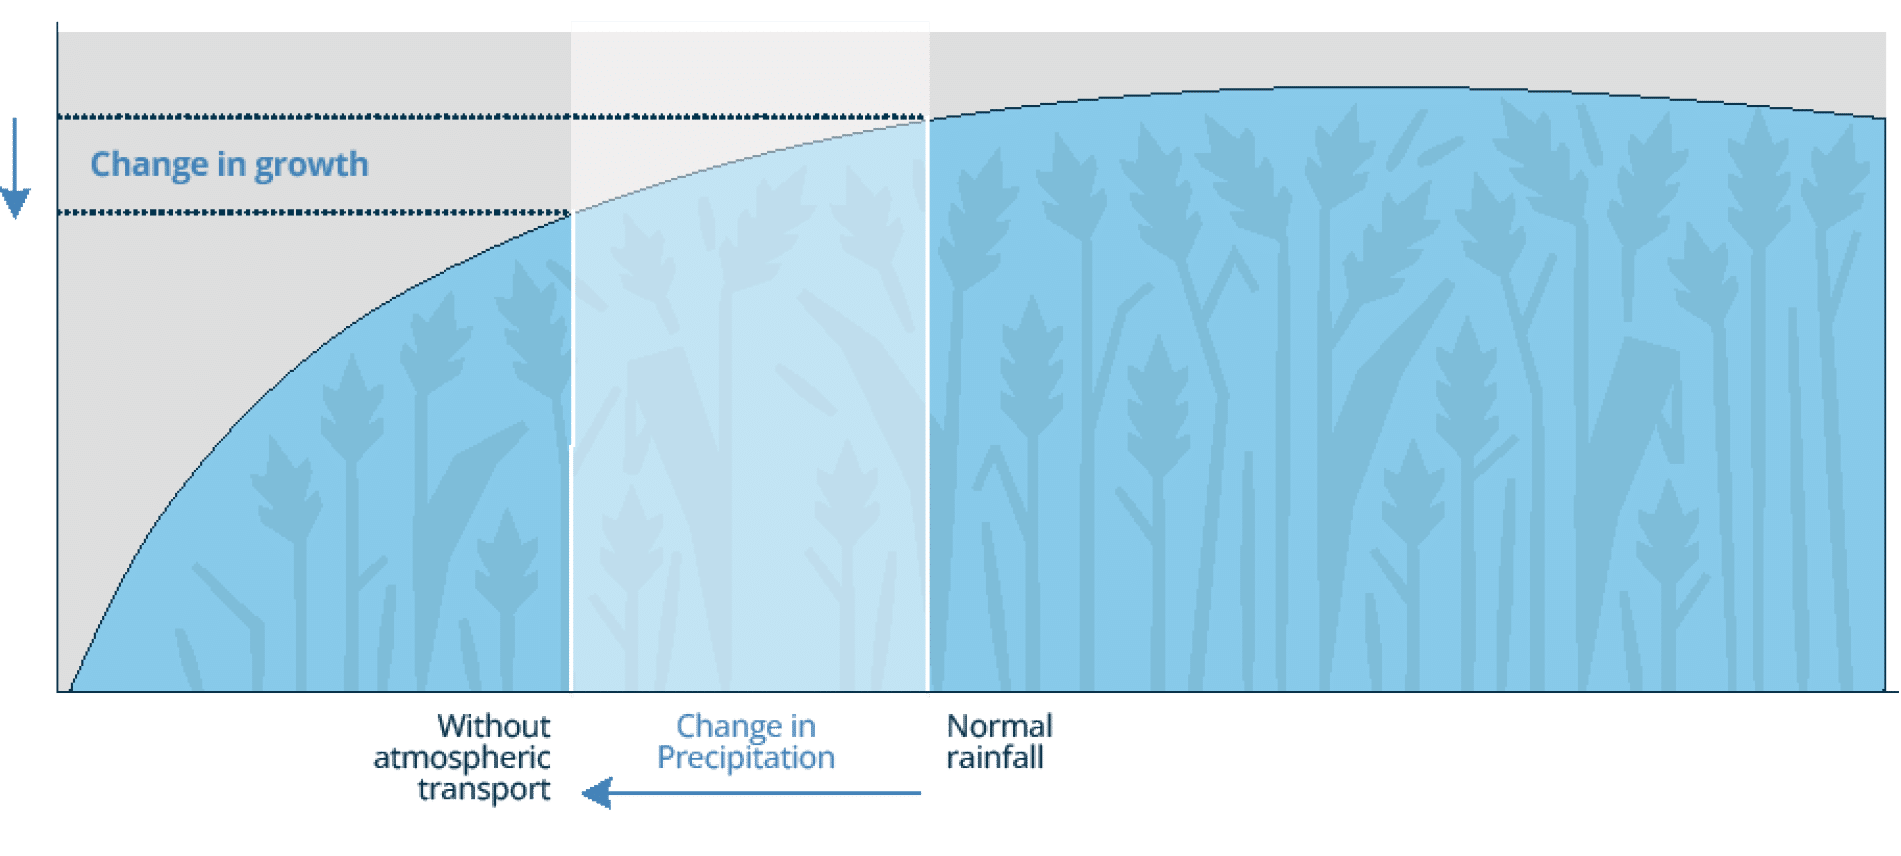
Existing literature provides causal empirical estimates of the effect of precipitation on growth rates of GDP (Kotz et al., 2022; Damania et al., 2020) and agricultural productivity (Ortiz-Bobea et al, 2021). These estimates are used to quantify the effect of removing precipitation derived from terrestrial moisture recycling in a location. Figure B3.2.1 illustrates the method used to conduct this calculation in a stylised illustration of the effects of rainfall on economic/agricultural output growth.
Figure B3.2.1: Changes in GDP or agricultural output growth rates due to
terrestrial moisture recycling, using established precipitation-growth response functions
The economy is a thirsty system, and water is a critical factor of production. As a result, diminishing water supplies translate into slower growth. This is particularly true in countries that are water dependent and where water scarcity is a pressing issue. The economic modelling in this section assesses the consequences of inaction in the face of diminishing water supplies to 2050. It shows that bad water-management policies exacerbate the adverse impacts of water stresses, while good policies can neutralise adverse effects and generate positive impacts. The costs of inaction are explored in a workhorse computable general equilibrium model (Box 3.3) using the standard Global Trade Analysis Project (GTAP) suite of economic data, combined with soft-links to data from GRACE estimates on total water storage, and Lund-Potsdam-Jena managed Land (LPJ-mL) model information on temperature, rainfall and green water (Chapter 2). As with all simulations, the results should be interpreted as model projections and not future forecasts.
Since water is a ubiquitous input, used explicitly or implicitly in all economic activity, there is uncertainty about the channels of impacts on the economy and how these interact to offset or magnify economic outcomes. To account for this uncertainty, projections are usually based on a range of parameters. This section accounts for parameter and outcome uncertainty to identify outcomes that are robust across a range of circumstances.
Computable general equilibrium models are a standard tool, widely used in economics to inform important policy decisions on issues ranging from trade agreements and impacts of infrastructure or industrial policy, to climate change, conservation strategies, and water resource management issues that could have long term consequences. Appendix 5 provides further details on methods and data sources.
As any modelling exercise, this approach has caveats and limitations. The results of any simulation exercise reflect the assumed structure of the model, and its calibration and parameterisation. A further complication is that models must grapple with uncertainty from myriad unknowable factors, such as future policies, growth rates, and the state of the environment. The outcome of a modelling exercise should thus not be viewed as a forecast of what will occur, but a projection that reflects the structure of the model and the scenario considered. Notwithstanding, models are useful to understand if current water imbalances will have significant economic impacts.
The computable general equilibrium model used for this exercise contains a representation of the world economy for 165 countries, and 14 production sectors and corresponding commodities. It uses data from several international statistical sources (e.g., GTAP 11, FAO, Water Footprint Network), and inputs from biophysical models, economic databases, econometric estimates and climate change projections. The model mimics a global system of economic agents (consumers, producers, governments) in interconnected markets where the endogenous variables (prices and quantities) are jointly determined. Parameters encompass production and utility functions, and include input-output coefficients; income shares of consumption for different commodities; and shares and elasticities of substitution for land, labour, capital, and water for different sectors and locations.
Green water influences total factor productivity in agriculture. Blue water is modelled as a primary resource and input in all economic activity. The model allows for unemployment and can distinguish high- and low-income and skill categories. The model’s solutions provide a framework to investigate how markets adjust to exogenous shocks. Although caution is required due to differing underlying assumptions, these results align with the Balanced Growth Equivalents (BGEs) from the Stern review (2006) of the economics of climate change.6 To have a more concrete reference for the scale and timing of changes, these “snapshots” are projected over a 30-year timeline using OECD forecasts and data.
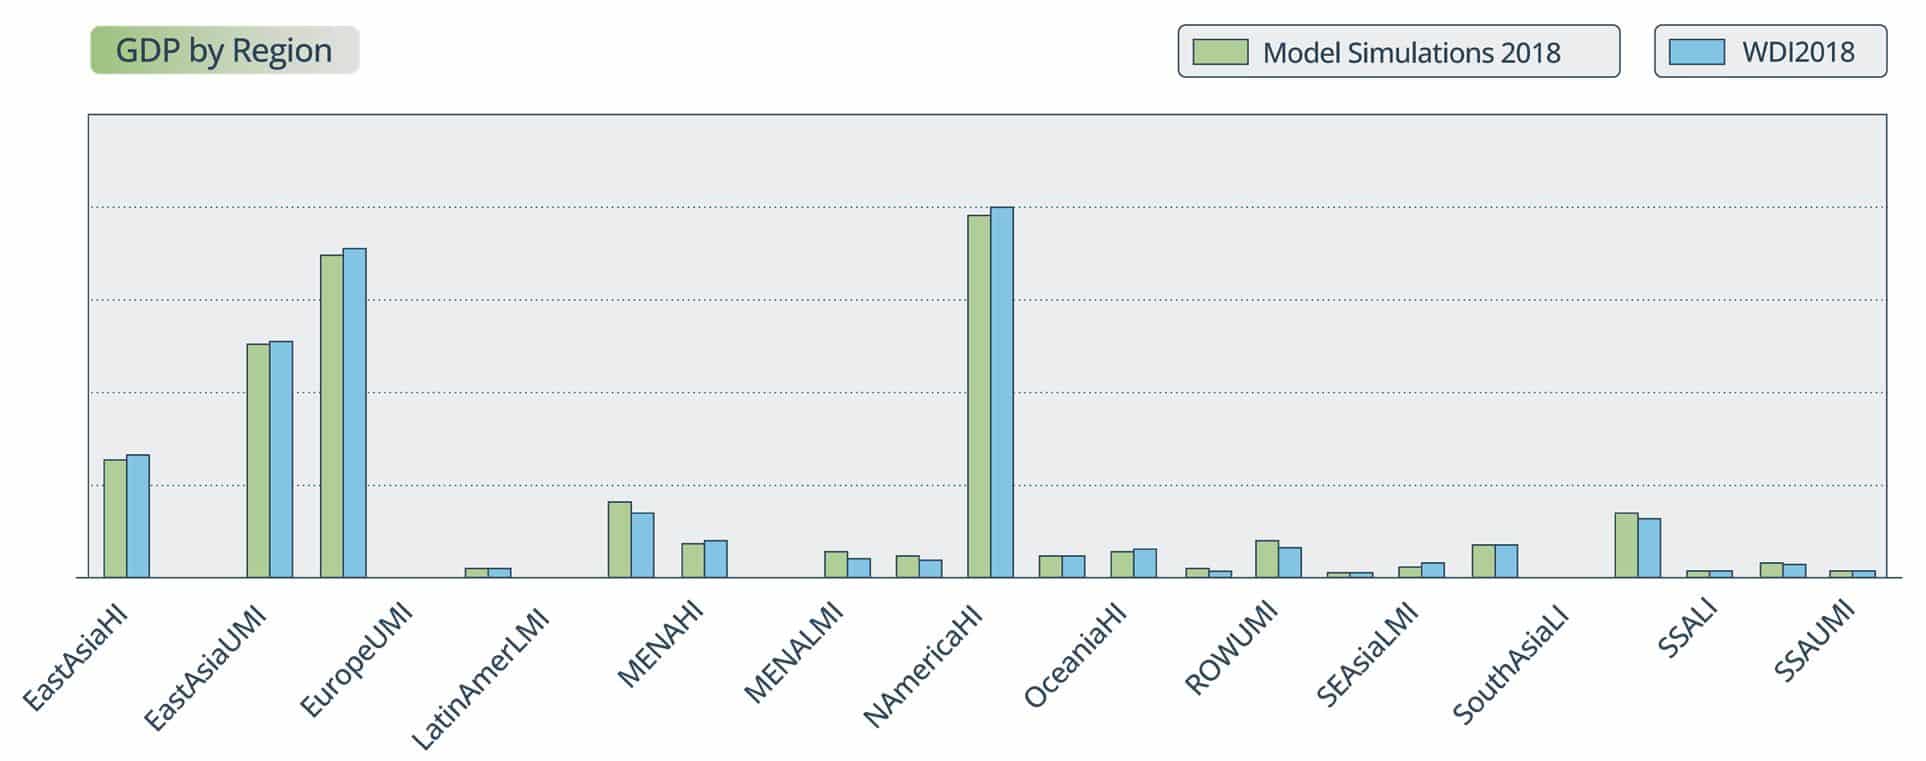
Figure B3.3.1 shows that the model projects the current situation with accuracy, capturing variations in factor incomes and overall economic activity. It can therefore provide a reasonable foundation upon which to investigate water imbalances in the short to medium term. The model operates in a stochastic framework due to significant uncertainties in climate change’s predictions, using Monte Carlo simulations to explore a range of potential outcomes. Its point estimates are on the high side because these are projections (not forecasts) that integrate potential impacts on both economic levels and long-term growth. Furthermore, unlike climate-change studies that focus on temperature, this model also allows for costs due to changes in precipitation patterns and water availability for production, consumption, sanitation, and health. The interval estimates align with results from the literature and from sources like the IPCC that emphasise the risks of delaying mitigation efforts.
Addressing uncertainty and aggregation effects
Models of economic impacts of climate change face uncertainties in parameters and variables. These include double-counting effects of temperature, precipitation, and related impacts across multiple sectors. They also include the potential for overlooking critical issues like aquifer depletion and climate-ecosystem feedback loops: model inputs might include the impact of increased temperature on agricultural productivity and water resources independently without accounting for the fact that changes in one can directly affect the other.
In addition to a careful model design to balance these risks, a two-fold strategy has been adopted to treat uncertainty in modelling the cost of inaction. This strategy accounts for the complexity of the computable general equilibrium database and the economic interactions it simulates. It has two main components: (1) scenario analysis, simulating temperature, precipitation, and total water storage changes separately and jointly to provide a spectrum of results under different economic and environmental conditions; and (2) stochastic modelling (Monte Carlo simulations), treating key inputs as random variables with specific probability distributions rather than fixed values, allowing for a range of outcomes to be explored.
The cumulative impact of changes in temperature and precipitation, along with variations in total water storage should be considered with caution, since total water storage might also be affected by changes in temperature and precipitation. To address this problem, bootstrap regression analyses on model outputs were undertaken and indicate that 20–28% of total water storage impact could be attributable to climate change. Consequently, the estimated impact was adjusted downward.
6For a detailed discussion of the assumptions and issues underlying the BGEs, see: Mirrlees, J.A. and Stern, N.H. (1972), “Fairly good plans”, Journal of Economic Theory, 4(2), pp.268-288; and Anthoff, D. and Tol, R.S. (2009), “The Impact of Climate Change on the Balanced Growth Equivalent: An Application of FUND” in Environmental and Resource Economics, 43, pp. 351-367.
A novel feature of the model is its focus on how rainfall and water storage impact the economy. The results are based upon the “moderate climate change scenario”, or the Intergovernmental Panel on Climate Change (IPCC) Representative Concentration Pathway (RCP) 4.5. Should water-related impacts be troublesome in this scenario, the predicament would be far grimmer in less optimistic futures.
Many impacts of climate change would be mediated through shifts in the hydrological cycle. Yet climate-econometric models struggle to identify and estimate the effects of changing hydrological patterns. These usually find that temperature has a large impact on economic outcomes, but that precipitation has a smaller, second-order or even a null impact. This result is not credible, and recent empirical work explores the reasons for these estimates (Appendix 4).
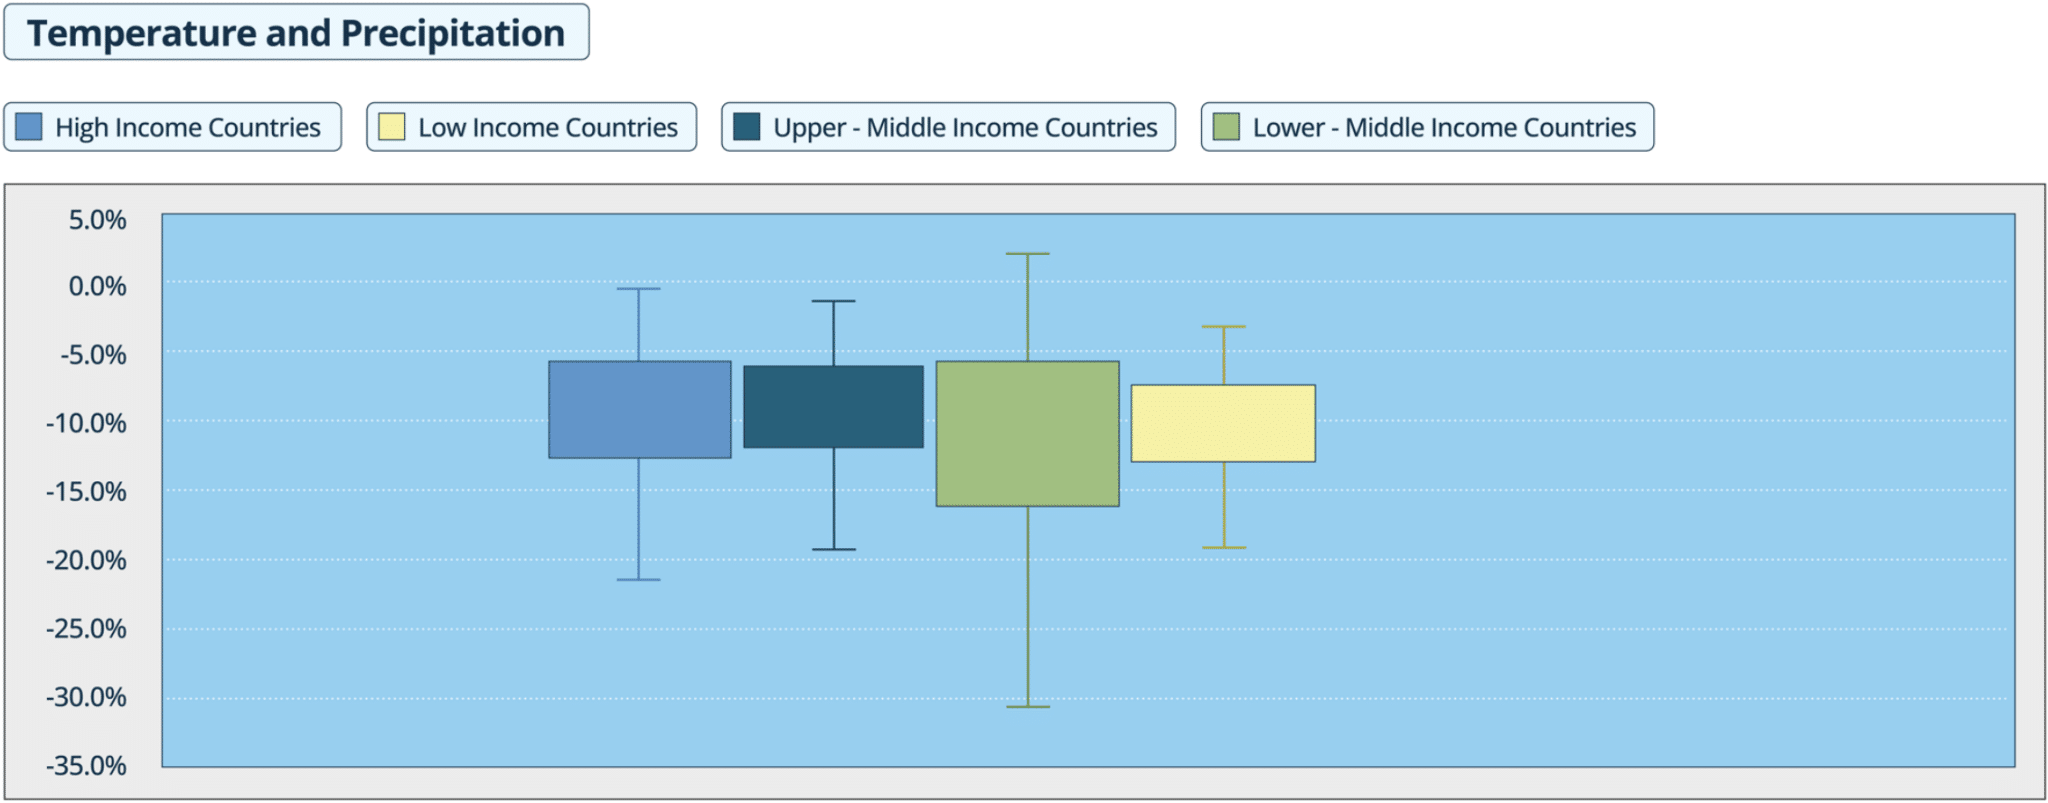
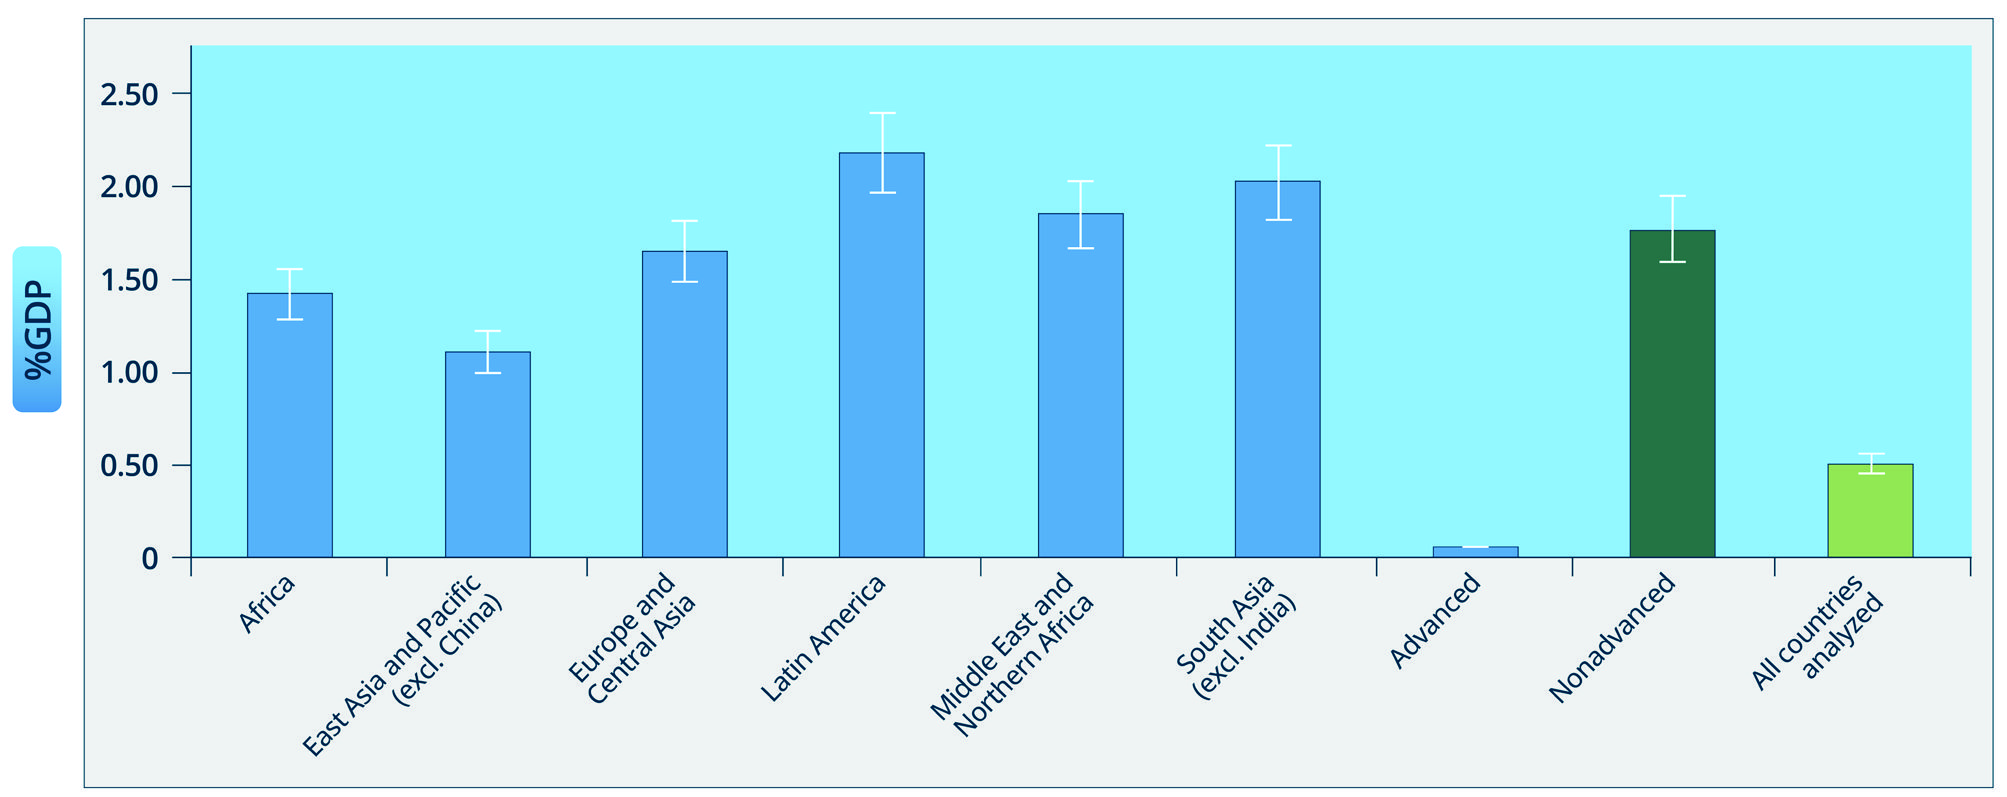
Considering rainfall and temperature effects, the economic impacts would be substantial (Figure 3.7). Simulations indicate a median GDP decline of approximately 8% from the business-as-usual scenario (with significant variation due to uncertainty) and marked disparities across regions and income groups. Food production (Appendix 4 would be affected severely, with more pronounced declines in low- and lower-middle-income countries. This reflects the nonlinear nature of climate impacts on agriculture and the heightened vulnerability of crop yields to temperature increases in regions where baseline temperatures are already high (Ortiz-Bobea, 2024). The largest relative decline would occur in South Asia and sub-Saharan Africa.
There are a range of climate-econometric estimates in the literature and these findings are consistent with recent work, such as by Kotz et al. (2024) and Bilal et al. (2024). The Stern review (2006) on the economics of climate change found that, without action, GDP would decline around 5% each year forever, based on market impacts, and by 11% when including the value of health impacts (Ackerman, 2007). The results of our model are in line with the Stern review, even though they are reported only for a selected terminal date (2050) due to the uncertainty surrounding future trajectories of both climate change and adaptation. They are also driven by explicitly modelling rainfall effects, made possible by better data and a more comprehensive methodology. Outcomes might appear high compared to some results in the literature. However, as demonstrated in Appendix 4, turning off the rainfall “channel” reduces the impacts, bringing them in line with recent studies that have used computable general equilibrium models.
Note: The whiskers depict upper and lower estimates from Monte Carlo simulations taking different parameters from the literature.
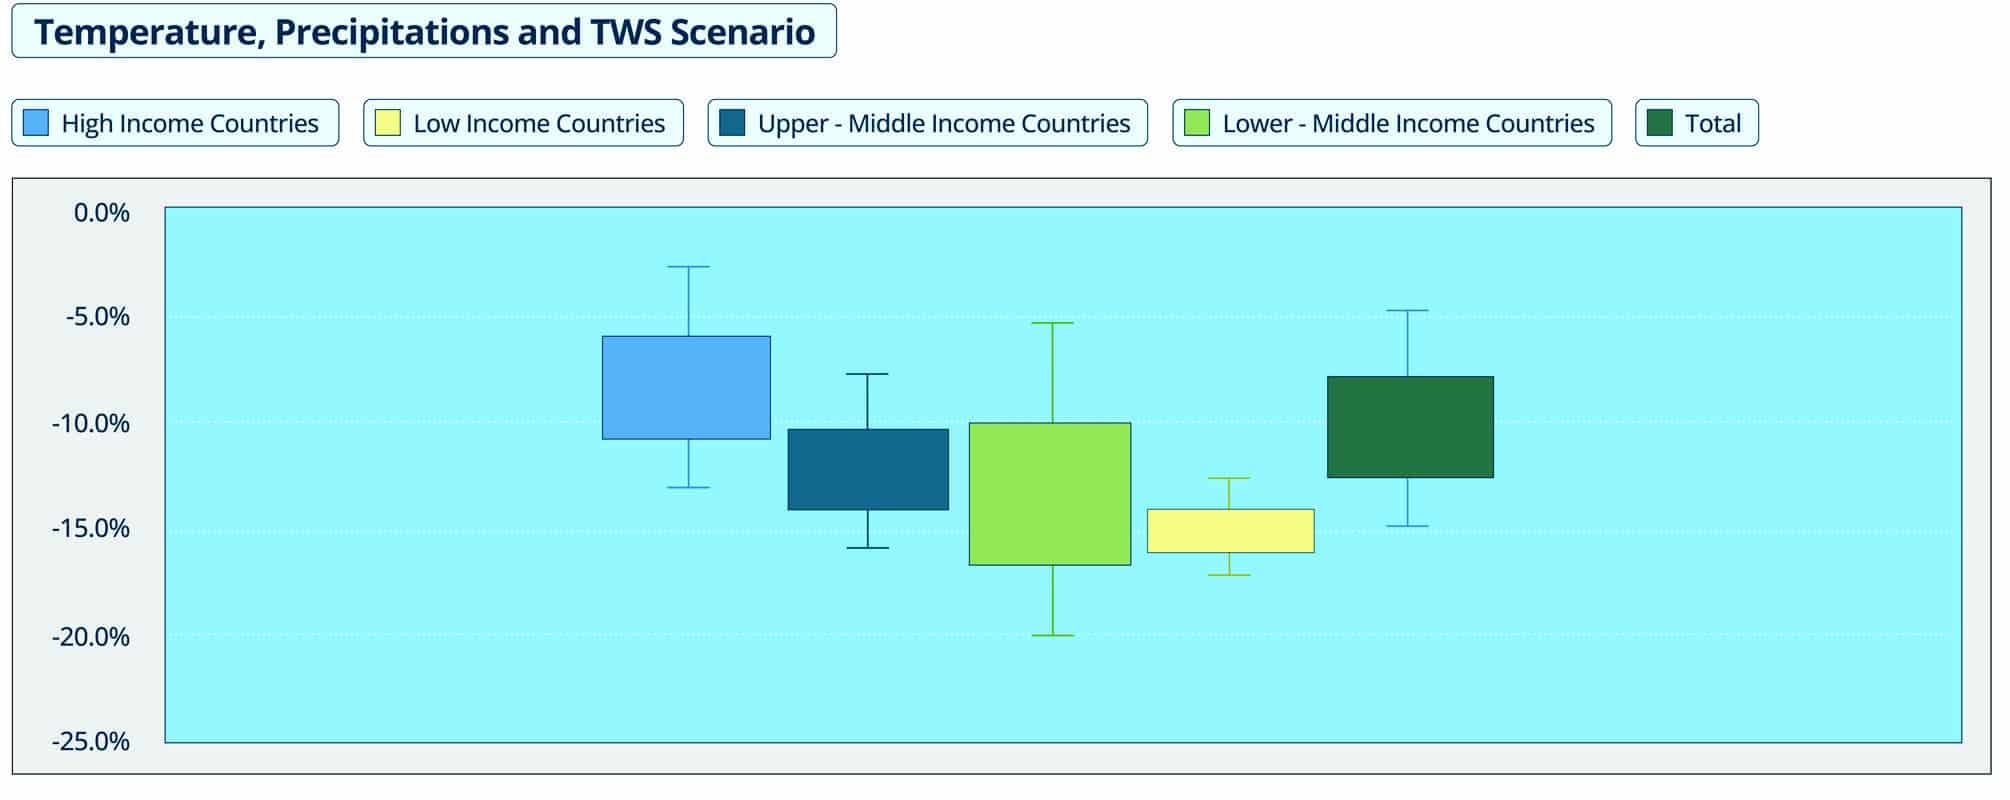
Ignoring trends in total water storage risks underestimating the economic impacts of shifting hydrological conditions. The model integrates these through supply curves that reflect changes in the availability of water resources. Figure 3.8 illustrates the combined impacts of temperature fluctuations, precipitation changes, and total water storage variations. The most significant declines in GDP and food production are observed in low- and middle-income countries, particularly in arid regions where water scarcity is already critical. Further specifics can be found in Appendix 4.
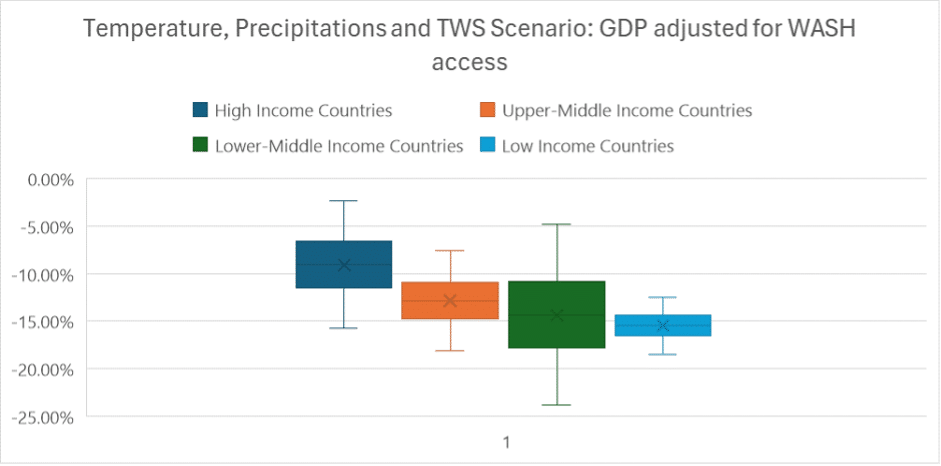
Lack of access to safe water and sanitation claims lives and inflicts severe losses of income. The triple burdens of rising temperatures, reduced total water storage, and lack of access to clean water forms a formidable barrier to progress. The World Bank approach to quantifying impacts on human capital and income is used to assess the magnitude of these losses. When combined with climate change and shifts in total water storage, the lack of access to clean water and adequate sanitation results in losses in GDP adjusted for human capital impacts averaging 14% as compared to the business-as-usual scenario. Table 3.1 highlights the effects of including water, sanitation, and hygiene (WASH) related losses by adjusting GDP to account for changes in human capital.7
Mean |
Median |
Upper Bound |
Lower Bound |
|
Lower-Middle Income Countries | -14.341% | -13.903% | -25.152% | -5.718% |
Low Income Countries | -15.476% | -15.339% | -18.909% | -12.742% |
Total | -14.411% | -13.992% | -24.765% | -6.154% |
Virtual water trade refers to the exchange of goods and services based on their virtual water content (VWC), defined as the amount of water required to produce each good and service including all steps involved in its production. Virtual water has become important in assessing global trade dynamics. Approximately 1.6 trillion cubic metres of water is traded in this way. When the price of water does not reflect its value and scarcity, trade can accentuate water depletion. For instance, it takes 12 litres of water to grow a single almond, and around 80% of almonds grown in the arid United States (US) state of California are exported. Notably, Californian production and export of almonds doubled during a period that coincided with droughts and land subsidence due to over-extraction of groundwater. Similarly, production of cotton in Uzbekistan has been linked to depletion of the Aral Sea.
These examples underscore how trade can intensify water overuse and depletion. However, trade can also mitigate water-related pressures by enabling countries with abundant hydrological resources to specialise in producing water-intensive goods for export to water-scarce nations. Estimates suggest that trading certain agricultural products saves about 300 cubic kilometres of water, roughly 5% of global agricultural blue water use (Fader et al., 2011).
Climate change and total water storage imbalances are poised to disrupt global trade by altering the costs of producing water-intensive goods. As climate change and declining total water storage trends drive up the implicit cost of water, the price of water-intensive goods rises relative to other commodities, diminishing the volume of virtual water traded. This affects agricultural production directly, leading to a global decline in the volume of agricultural commodities traded, with effects across all economic activities.8
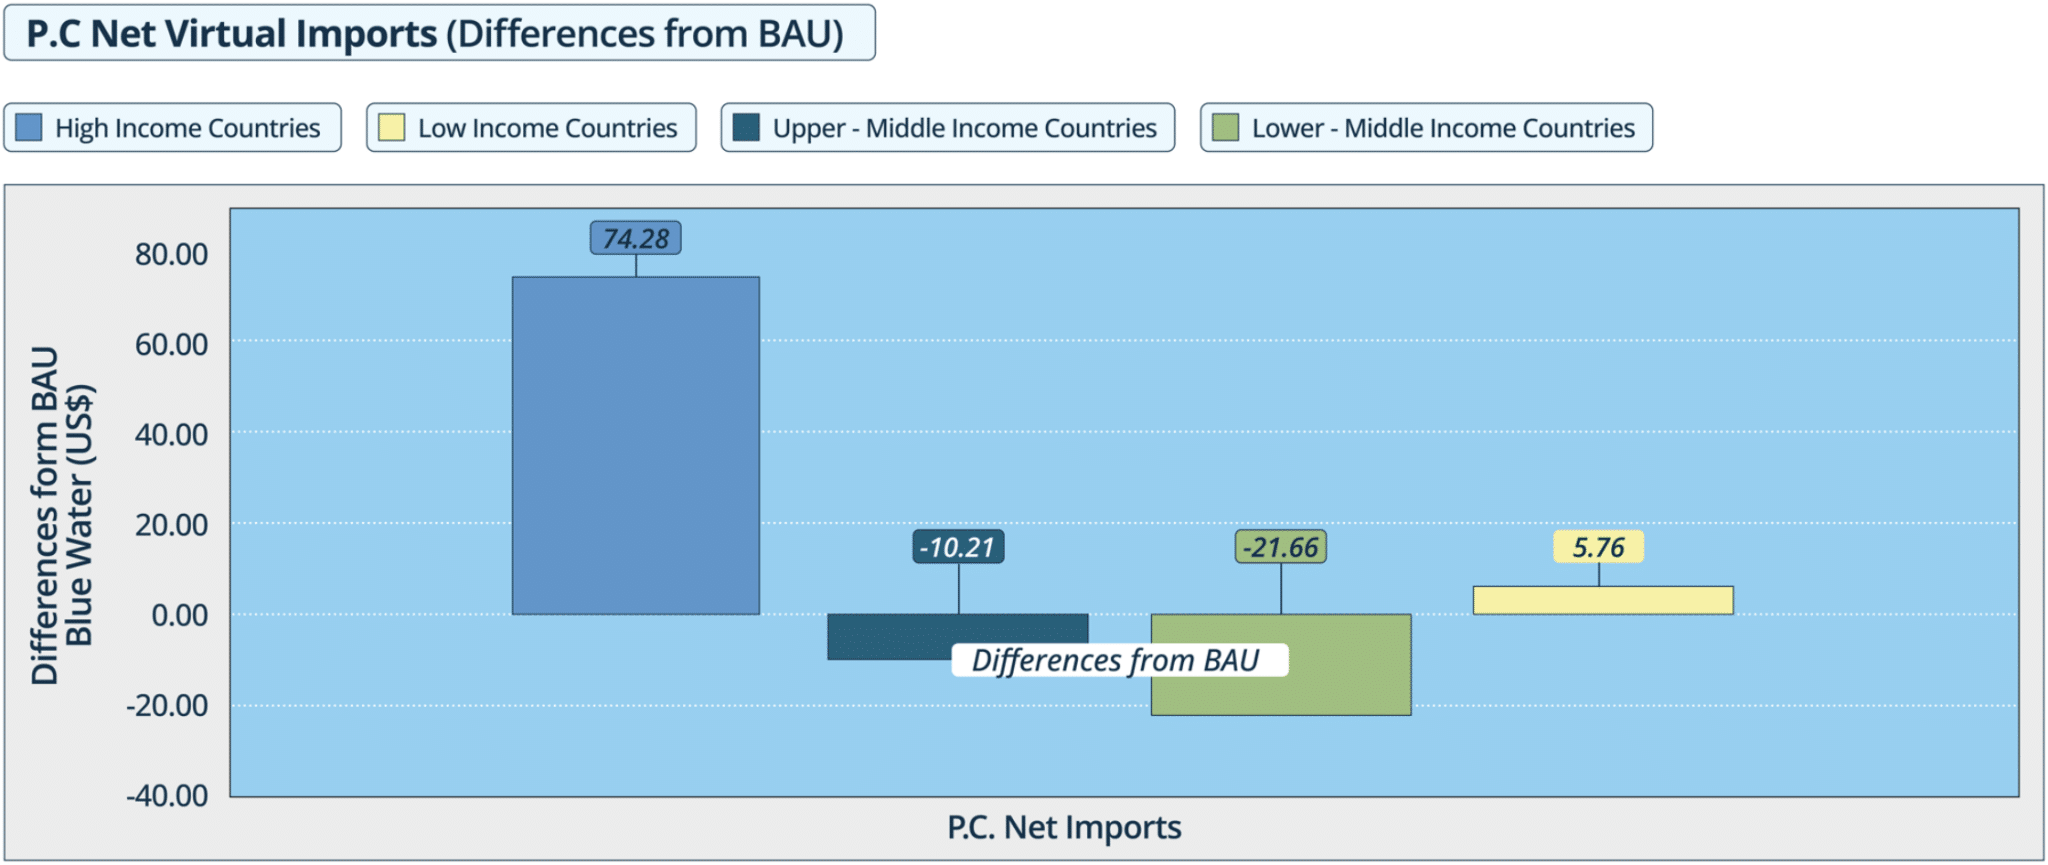
Deteriorating hydrological conditions also induce shifts in the natural comparative advantage of countries, changes in efficiency levels, market conditions and government interventions. Model simulations suggest that higher income countries reduce their exports and increase imports while the poorest countries – heavily reliant on agriculture – are negatively, but not disproportionately impacted (Figure 3.10).
Notes: The simulations show effects from climate change and variations in total water storage. High-income countries (net exporters) show a substantial increase, suggesting reduced exports and increased imports of virtual water. Upper-middle, lower-middle, and low-income countries (net importers) experience declines in net virtual water imports.
7This can be considered extended GDP losses including human capital (echoing Net National Product principles).
8The model does not consider speculative responses such as shorting or monopolising markets. It could be argued that, since most basic commodity markets are competitive, with numerous sources of supply, such attempts might not have lasting, significant global impacts but could be of a concern in smaller, regional markets not well linked to more competitive markets – though this possibility cannot be ruled out a priori.
When confronted with rising global prices for agriculture, countries often respond by restricting exports. The surge in rice and wheat prices has elicited such responses. Though protectionism might appear necessary for food security, it results in a uniform GDP decline, disproportionately impacting upper-middle-income countries due to altered trade patterns (Appendix 4). This confirms that retreating into protectionism amid supply shortages is counterproductive, leaving all parties worse off.
The effects on trade reported in the model are the differences between the model scenarios described. Under the simulated scenarios, even though growth will occur and overall trends in virtual water trade will remain positive, the water-related stresses are projected to reduce virtual water trade relative to this baseline by influencing GDP, and trade patterns. These results reflect higher water scarcity, making products based on water-intensive value chains less economically viable especially in water-stressed regions. This would not only reduce the exports of these products but contract their whole value chain in comparison to a scenario without water stress. Additionally, climate change’s negative impact on GDP, particularly in agriculture-dependent, low-income countries, would diminish their capacity to produce and export water-intensive commodities.
Most literature supports the view that these combined factors will make the current trends in virtual water consumption unsustainable, which will likely lead to a contraction in virtual water trade. For example, Dalin et al. (2012) highlight that climate change might force virtual water trade to become increasingly concentrated in a few key importing countries. Konar et al. (2013) finds that water scarcity might reduce the total volume of virtual water trade. Orlowsky et al. (2014) and Sartori et al. (2017) suggest that unsustainable water consumption and reliance on exporting nations could lead to “imported water stress” for some countries. In contrast, Graham et al. (2020) project a significant increase in virtual water trade combining a business-as-usual scenario with future climate changes. These reported estimates are cumulative changes rather than a direct comparison of scenarios with and without climate change. Their results rely on the Global Change Assessment Model (GCAM), an integrated assessment model (IAM) that links various systems (energy, water, land) using a different approach and assumptions compared to those used in computable general equilibrium models to represent markets, economic agents, and trends (Gambhir et al., 2019).
The economic consequences of water stress are exacerbated by policies that promote overuse and allocate water in ways that neither reflect the benefits water could bring nor consider equity and environmental sustainability. The computable general equilibrium framework offers a valuable lens through which to explore the extent to which better-aligned incentives can reverse or mitigate adverse impacts.
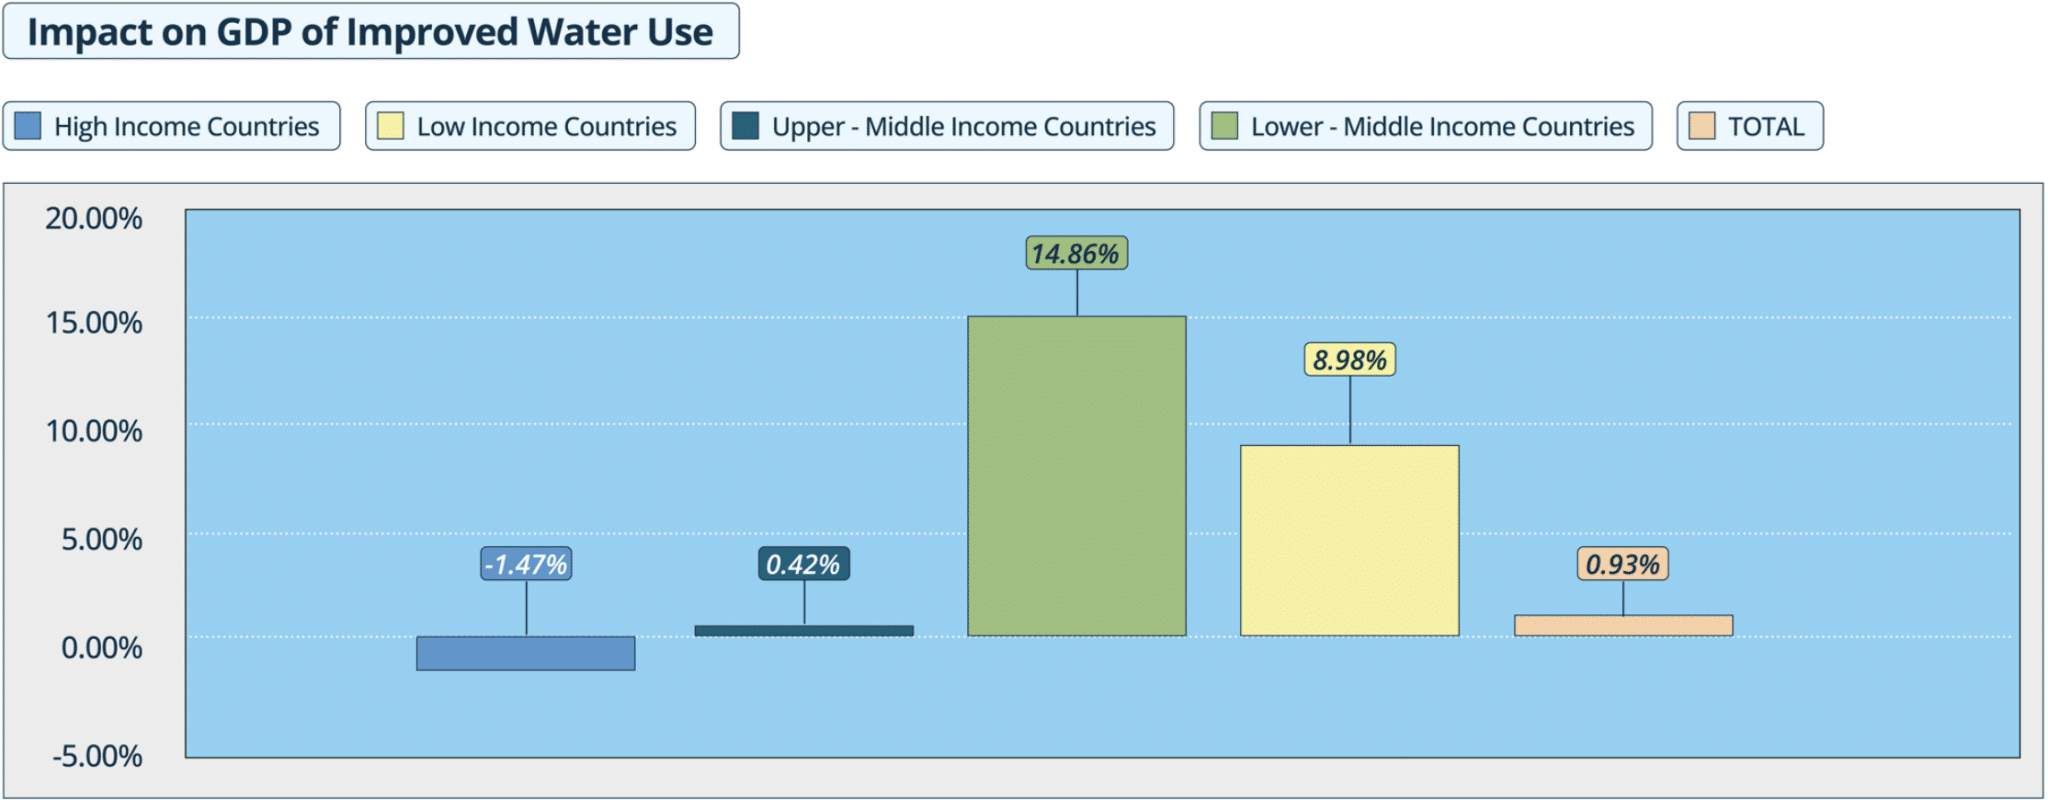
Figure 3.11 illustrates the outcomes of a policy experiment where water tariffs are adjusted to reflect externalities and scarcity. GDP sees significant gains in low- and middle-income countries, which are predominantly water-scarce. Conversely, the impacts are minimal to negligible in higher-income countries, as in many cases they have more abundant water resources and economies that are less dependent on agriculture. Addressing market failures and scarcity constraints is thus pro-poor and benefits water-stressed lower-income countries more than higher-income countries. Simulations suggest that this robust finding holds even when a subset of countries introduce such efficiency pricing.
These results illustrate that improving resource allocation, whether by tariffs or other means, renders production and consumption activities more responsive to water scarcity and opportunity costs. These effects would ripple through the economy with positive feedback on water availability and long-term sustainability.
Notes: The figure illustrates the impact of implementing a policy package focused on pricing and recycling revenues to enhance water efficiency and reduce related resource misallocation. The results suggest that this policy package significantly mitigates losses relative to the climate change scenario for lower-middle-income and low-income countries, with approximately 15% and 8% higher GDP levels, respectively. In contrast, high-income and upper-middle-income countries experience minimal changes. By addressing externalities through targeted policies, countries can achieve greater efficiency and improved resource management, especially benefiting those with economies heavily reliant on water.
The results suggest that aligning economic incentives with water scarcity could yield a triple dividend: (1) water-related impacts of climate change are largely neutralised, improving climate resilience; (2) equity increases, since the benefits are distinctly pro-poor at country level; and (3) environmental benefits accrue, since resource depletion is ameliorated. It is rare to find such synergies.
The simulations further indicate that, while pricing water to reflect its implicit cost could improve economic outcomes, this is insufficient to eliminate economic inefficiencies related to water use. In a second-best world where the economy is plagued by other distortions, such as harmful subsidies and monopolies, addressing distortions in one sector will not be as effective while they prevail in others. For instance, pervasive agriculture or energy subsidies make appropriate water pricing less effective. Complementary interventions can amplify the economic, equity, and environmental gains in these cases: the benefits of pricing policies can be increased by eliminating subsidies in water-intensive sectors or by shifting them to water-saving technologies and approaches to address possible rebound (Jevons) effects.9
Current policies are not appropriate for the water challenges of the 21st Century. Unsustainable trends in water resources reflect at least in part policy deficiencies that fail to incentivise prudent management and stewardship. Water management is dominated by mechanisms such as government allocation and water-sharing rules that seldom reflect the marginal value of water and can promote wastage and overuse.
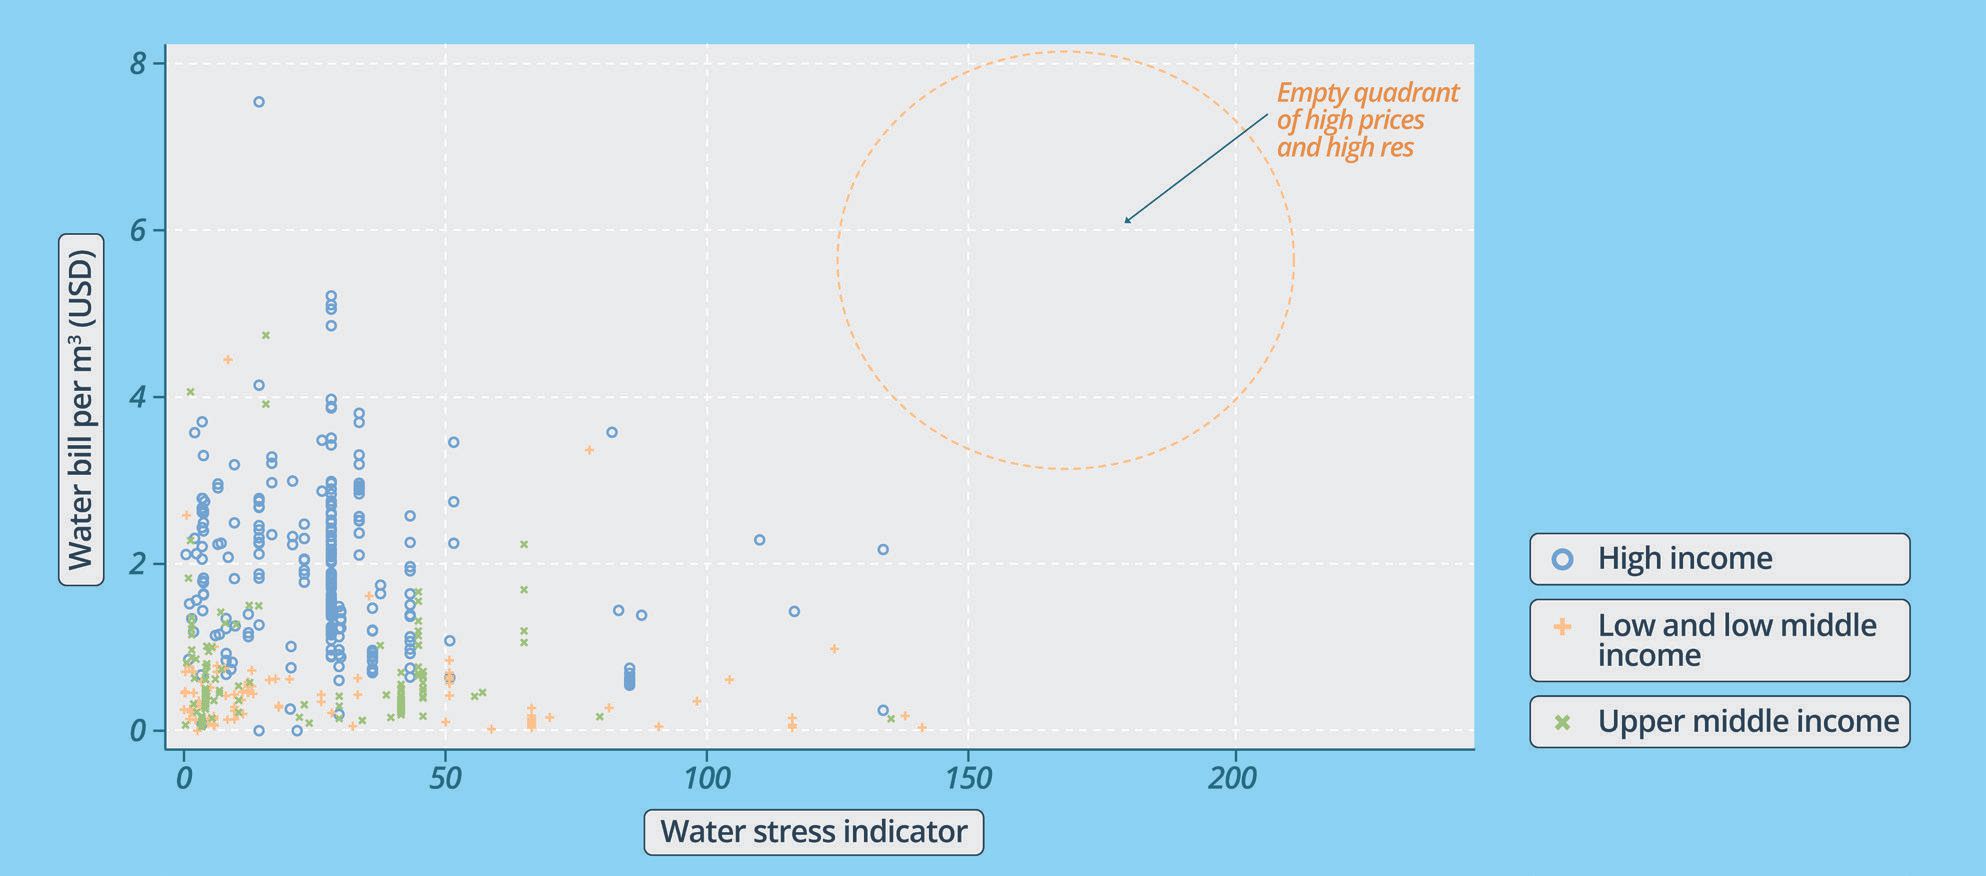
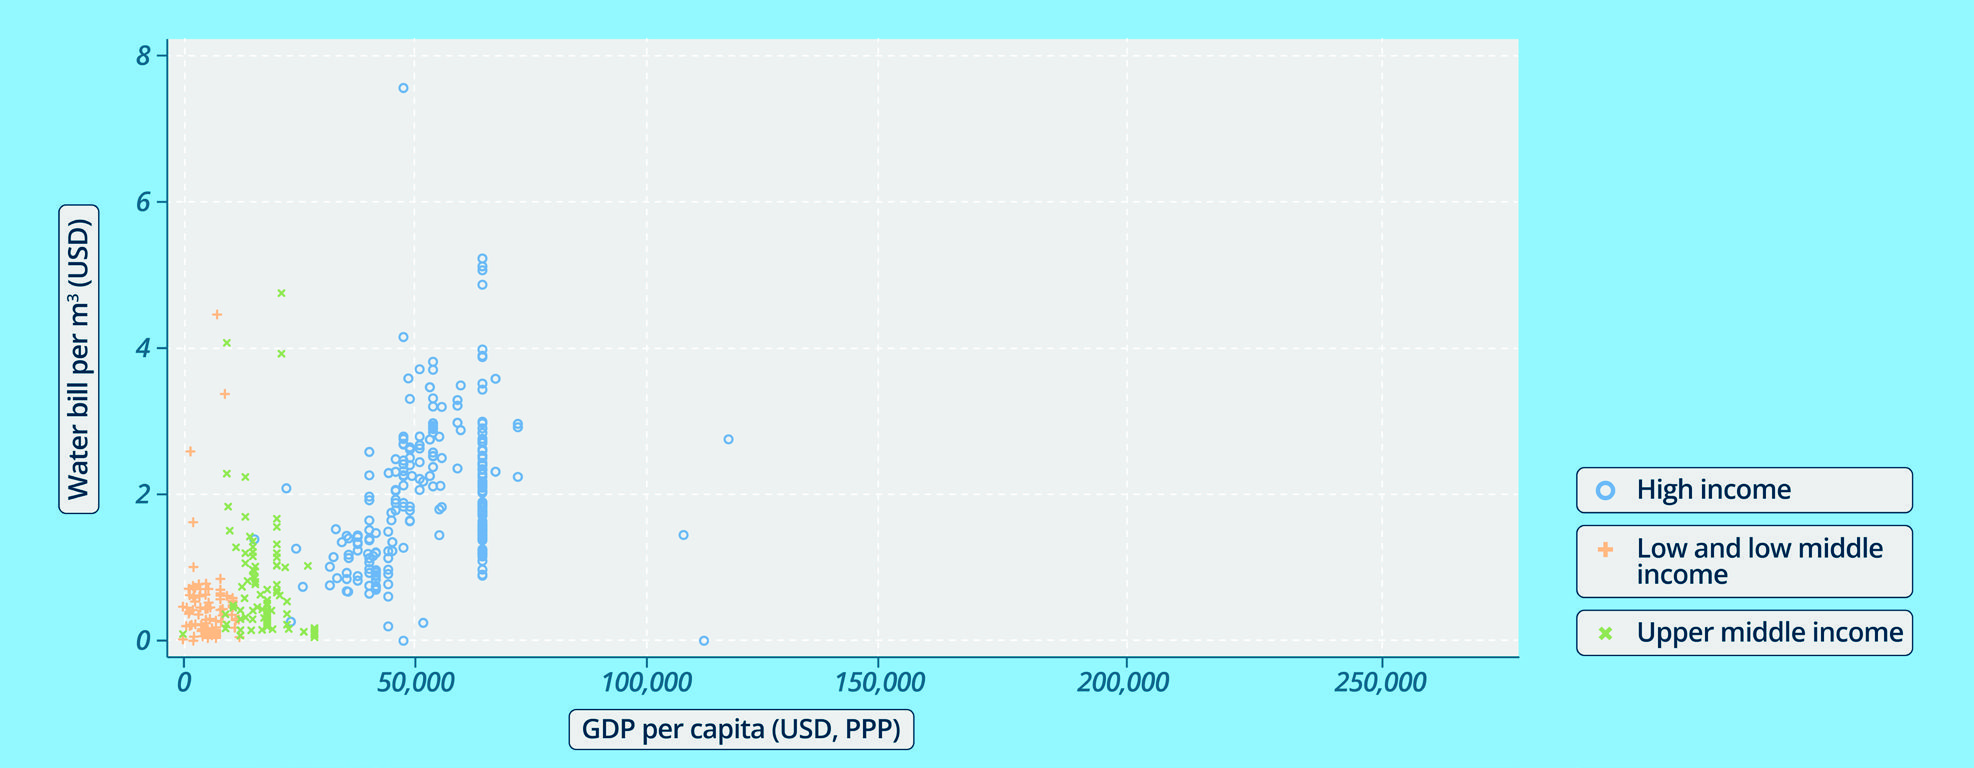
Pricing patterns are often perverse. Figure 3.12 indicates that the lowest water tariffs are frequently encountered in some of the most water-stressed nations. These do not appear to stem from concerns about equity or affordability, as some affluent countries with high levels of water stress have among the lowest water tariffs in the world. Prices in these countries reflect neither scarcity conditions nor users’ capacity to pay.
Notes: Water stress is defined as the ratio between total freshwater withdrawn by all major sectors and total renewable freshwater resources, after considering environmental water requirements. This indicator is also known as water withdrawal intensity. Main sectors as defined by ISIC standards include agriculture, forestry and fishing, manufacturing, electricity, and services.
Concerns about how to price water have long been debated. High prices could exclude the poor, while a price that is too low encourages profligate use and creates economic and environmental costs. Appropriate pricing typically depends on a mix of policy instruments: where safety nets exist to assist lower-income households, prices can recover the high cost of capital-intensive water infrastructure, signal scarcity, and reduce overuse and waste. In practice, this is more the exception than the rule.
The price of water is low in most settings and far below the level required to balance supply and demand. Prices in most countries are well below the range that make water-saving a financial consideration. As a result, studies find that the demand for water is price-insensitive (inelastic) at prevailing prices. In some cases – especially in the irrigation sector – low prices combine with low collection rates and offer little incentive to use water more efficiently and curb waste. Meanwhile, a concern in urban settings is tariff structures that are complex and difficult for consumers to understand. This diminishes the effectiveness of higher prices as a tool to encourage prudent water use.
Water pricing remains controversial and complex. Economic instruments like water permits and pricing can promote better environmental stewardship, but there are valid concerns that these could exacerbate inequities. There are fears of elite capture, denial of services to the poor, and neglect of water’s social and cultural significance. The success of water policies hinges on systems that embrace equity concerns rather than using this challenge to eschew attempts to incentivise more environmentally and economically prudent water use. A well-designed system would differentiate between the poor (be they subsistence farmers or city dwellers) and other users (including industries and large-scale farms) who have greater capacity to pay. Various policy options can address affordability concerns: targeted cash transfers and subsidies (facilitated by digital technologies) can support poor households; free or subsidised water can serve as a safety net; and free water connections for the poor in urban areas can reduce reliance on informal vendors.
Conversely, commercial users, including industries and large-scale farms, typically have a higher ability to pay. Charging rates that reflect the true opportunity cost and scarcity of water can incentivise improved allocation and more judicious use of water. However, current policies often do the reverse. Underpriced water and industrial policies in “priority” sectors encourage water-intensive industries to locate in some of the most arid parts of the world.
Agriculture, the principal consumer of blue water globally, exerts a strong influence on the availability and sustainability of water resources. In most countries, water is allocated to farmers through rationing and sharing rules. The design and evolution of these often mirror water availability, legal traditions, and community norms, which may lag behind rapidly changing hydrological and socioeconomic conditions. Such systems are particularly crucial where water is scarce.
In regions where water is plentiful, as in much of the eastern US, riparian doctrines permit unrestricted use rights to lands adjoining waterways. Conversely, in the arid western US, water rights have been decoupled from land to facilitate investment in irrigation (Leonard & Libecap, 2019). In the Middle East, where water is typically scarce, aflaj water systems define rights as time-based shares rather than absolute quantities. This implies that shortages are shared proportionally as flow rates diminish (Bandyopadhyay & Mershen, 2022). In some parts of Latin America, acequias rights are allocated to individuals based on the volume extracted. Each allocation system specifies how shortfalls are distributed during times of scarcity.
Each of these systems addresses specific problems but brings challenges of efficiency, equity, and environmental sustainability. Proportional sharing rules such as aflaj and acequias maintain higher crop yields than a seniority allocation (Gómez-Limón et al., 2021; Ji & Cobourn, 2018), but they are also inefficient, as sharing leads to overcapitalisation and therefore overuse of water (Smith, 2021).
Sharing rules that prioritise certain users, such as seniority allocation, generate inefficiencies when junior users are more productive (Bennett, 2000). The most striking example is urban water, which holds junior water rights in the western US, but serves many more people and generates multiple times more social and economic returns than irrigated commercial agriculture.
Of even greater concern is the vulnerability of administrative allocation schemes to rent-seeking and political influence, with perverse distributional consequences (Wade, 1982). Resource capture and the fate of poorer farmers at the tail-end of irrigation canals have been widely documented (Jacoby et al., 2021), but there is limited empirical research due to the clandestine nature of corruption.
Despite the magnitude of water use in agriculture, information on the prices charged to farmers for irrigation services is fragmented and unreliable, and almost non-existent in developing countries. What information exists suggests that irrigators pay a small fraction, if any, of the water price charged to urban users (Cornish & Perry, 2003). Surveys of developed countries conducted many years ago by the OECD (2010) provide an indication of pricing patterns and trends that likely remain relevant. OECD economies aim for cost recovery, but few attempt to price irrigation water to manage demand or address environmental externalities. Wealthier OECD countries have largely achieved full recovery of annual operating and maintenance costs, and partial recovery of capital costs. There is a wide range of pricing mechanisms used even within a country (Cornish et al., 2004). Some cases use volumetric charges while others base them on farm size or factors unrelated to water use.
Information for developing countries is even more limited and unreliable. The only available and partial survey, conducted by the World Bank in 2020, finds that 94% of the 38 countries covered do not recover any operation and maintenance costs (Damania et al., 2023). Water is effectively supplied free in most cases, often treated by governments as a form of social security. Consequently, larger and wealthier farmers capture most of the benefits, deepening inequalities.
The magnitude of direct and indirect subsidies accruing to water users in agriculture is vast, likely far exceeding USD 0.5 trillion. Water users benefit from the use of free or underpriced water, the extent of which is unquantified. They benefit from subsidies to the agricultural sector, estimated to exceed USD 630 billion per year (OECD, 2023).10 More than 60% of these are coupled with production, implying that farmers receive support for buying specific inputs or growing specific crops. This distorts farmers’ decisions, reducing productivity and causing harmful environmental spillovers such as deforestation, polluted waterways, and depleted water supplies – often beyond national borders. In particular (Damania et al., 2023):
10Transferred to individual producers during 2020-22.
There is more information available in the municipal sector as part of global efforts to monitor water-utility performance. Available data12 are incomplete and unrepresentative, but still indicative of the extent of pricing and practices. Figure 3.13 shows vast variation in the average prices charged for municipal water services. In general, utilities in higher-income countries set higher prices, reflecting both higher labour costs and a greater willingness to pay that affluence brings. Notably, small island economies, which confront high supply costs, also tend to have higher charges, irrespective of income levels.
Countries with low prices recover neither operation and maintenance costs nor capital costs, and depend on government subsidies to cover financial deficits. While these might be well-intentioned, they bring unintended consequences. Poor tariff design can undermine equity objectives, rendering subsidies expensive, poorly targeted, and distortionary (Andres et al., 2014). Figure 3.14 shows that subsidies are common across countries, irrespective of region or income. They are expensive – estimated at around USD 300 billion annually – with a mere 6% of the benefit accruing to the poorest 20% of the population (Andres et al., 2014). Finally, by weakening the link between consumption of water and the cost of providing it, subsidies promote overuse.
11Excess nitrogen runoff from fields ends up in drinking water. Once water is contaminated, denitrification is a costly process.
12The data is from IBNET, a World Bank and Global Water Intel initiative. There is likely a consistent bias in this data with utilities submitting data in years of good performance. This leads to potentially severe attenuation biases that should be noted in interpreting the data.
Source: Andres et al., 2014
In low-income countries with limited fiscal space, a reliance on subsidies will often mean that universal access to water is unaffordable. Thus, low prices result in limited access to piped water and sanitation services. In such circumstances, poor households who do not have connections must obtain water as best they can from traditional sources, water vendors, or public taps on the piped distribution system. As a result, unconnected households pay far more for water than rich, connected households in either money, time, or both (Pattanayak et al., 2005). Further, lack of access to safe water services is associated with a host of water-related diseases. Globally, 2.2 billion people lack access to safe water and 3.4 billion do not have access to a safe toilet (WHO/UNICEF, 2023).
Further complications arise from the natural-monopoly characteristic of water supply infrastructure. The most cost-effective way to supply water to consumers is through a single pipe, which in turn must have a single owner—a natural monopolist. This brings the risk that water suppliers (utilities) will leverage their monopoly power by inflating costs or raising prices. However, simple pricing rules that aim to recover costs without considering the scope for cost inflation would incentivise waste and condone inefficiencies. In general, around 28% of public funds allocated to the sector go unspent, and a typical water utility experiences efficiency losses averaging USD 21 million, equivalent to 16% of operating costs (Joseph et al., 2024). These inefficiencies result in substantial hidden costs, likely amounting to hundreds of billions of dollars globally. Addressing this problem calls for strategies that balance the interests of the monopolist (whether private or public) against wider public policy goals.
Current water policies are unable to address the challenges of the Anthropocene, resulting in an unacceptably high human and economic toll. This suggests the need for a significant shift in water governance policies, guided by three overarching principles: (1) value water for the essential services it provides; (2) establish absolute limits to ensure its sustainability; and (3) develop policy packages to promote synergies.
The failure to value water and acknowledge its economic, environmental, and societal contributions remains a significant obstacle to progress and the implementation of the United Nations (UN) Sustainable Development Goals (SDGs). Water is rarely priced in ways that reflect its scarcity and contribution. Thus, it is used wastefully and seldom allocated to its most beneficial uses.
Improved allocation could be achieved through infrastructure and regulations (top-down command-and-control approaches), and economic instruments such as pricing and trade. Under any policy regime, safeguards would need to assure access for poor households and environmentally sustainable and prudent uses, as shortages typically create “rents” that are vulnerable to capture.
Economic instruments can be powerful mechanisms to promote better water management, but face resistance from users accustomed to subsidised water. Recognising that good economics is not necessarily good politics, approaches now being piloted are better aligned with the incentives and constraints of decision-makers. For instance, experience suggests that price reforms, such as the elimination of environmentally harmful subsidies, are more likely to gain public acceptance when accompanied by compensation and safety nets that protect the poor and marginalised populations.
Acknowledging that blue and green water are both generally renewable but also finite resources implies that there are absolute limits to the amount of water that can be consumed safely and sustainably. As suggested by Barbier (2022), acknowledging that the economy is embedded in the biosphere implies that there are absolute limits to the extent to which resources, that have no close substitute, can be sustainably used. This has implications for the management of critical natural resources (Sureth et al., 2023).
For blue water, this will mean determining explicit limits on the amount of water withdrawn, and limits on pollution concentrations. Water-stressed regions might need to realign their economies and produce goods that better reflect their natural resource endowments and comparative advantages. Trade in virtual water will be critical to easing supply constraints and decoupling consumption of water-intensive goods from their production. Virtual-water trade can also lead to efficiency and water savings if trade in water-intensive commodities flows from regions with high water resources and high productivity to regions with lower water productivity.
For green water, absolute limits will involve protecting forests and wetlands as the sources of terrestrial moisture supply, will require policies and incentives to conserve soil moisture, which holds around 60% of terrestrial rainfall. Thus far, scalable solutions have remained elusive as the forces of deforestation are powerful and deliberate, while conservation policies have been less effective and slow to react. It is unlikely that small adjustments to current policymaking will solve this sustainability challenge, suggesting the need for bold targets and ambitious reforms.
No single policy can achieve the goals of efficiency, equity, and environmental sustainability at once. Policy packages will need to address the trade-offs likely to emerge. For instance, higher water prices might promote greater efficiency but disproportionately impact the poor, calling for compensation to achieve equity goals. Policy packages will also need to address distortions that originate outside the water sector and can stymie reforms within it. For example, subsidies to water-intensive crops or industries directly undermine the ability of water prices to regulate demand.
Recent empirical and experimental evidence provides valuable lessons about the effectiveness of different approaches attempted to promote more efficient, equitable, and sustainable water management. A critical takeaway is that in “second-best” scenarios characterised by multiple distortions, concentrating solely on the water sector can lead to suboptimal outcomes and potentially unintended repercussions. Additionally, these strategies are noteworthy for acknowledging implementation hurdles, transactions costs, and the constraints and motivations that drive decision-makers.
While pricing incentivises more efficient and judicious use of water, introducing water prices in the agricultural sector has often involved political and logistical challenges. The transactions costs of pricing can be considerable in developing countries, where irrigation is practiced by large numbers of small-scale users. Moreover, irrigation pumps are typically not metred or metres that are installed are not tamper-proof. In such settings, enforcement and billing can be logistically difficult. Hence several alternative approaches are being piloted across countries.
A vast literature finds that the subsidisation of water leads to overuse and waste (Barbier, 2015). Repurposing poorly designed subsidies yields multiple benefits in promoting efficiency, expanding water-related services, and improving equity (Trimmer et al., 2022). The lessons learned from past subsidy and policy reform efforts converge on three keys to success: (1) compensating those who lose and would resist reform; (2) communicating to build coalitions of support; and (3) charting a credible reform strategy that will not be reversed. Generally, pricing water used by small-scale and low-income farmers would need to be accompanied by appropriate safety nets and alternative forms of support. One such approach involves shifting direct water subsidies and implicit subsidies inherent in the provision of free water into compensation that combines water billing with direct monetary transfers to users.
There is a trend towards new, field-tested alternative approaches that could achieve some of the same benefits as pricing while circumventing the political obstacles. While such approaches might only offer less-effective “second-best” solutions, they could be the only feasible options. One recent innovation makes cash transfers conditional on the verifiable adoption of water-saving practices, such as shifting cultivation to less water-demanding crops. The effectiveness of such programmes is worth evaluating. The literature also provides guidance on how to test for leakage and additionality.
The use of water and the energy to pump it are often intertwined. This nexus can generate opportunities to save both water and energy through more efficient use. Energy prices for pumping can be used to internalise the scarcity cost of water to some degree, and power rationing can limit water extraction. However, it can also make energy subsidies lead to excessive use of water. In India, power for pumping groundwater is often provided at low or zero rates, which is thought by many to exacerbate excessive groundwater pumping. Here too, these challenges call for the development and testing of creative ways to generate indirect price-like incentives. For example, programs were proposed that incentivised farmers in India to voluntarily reduce power use for pumping groundwater below a given benchmark, with a volumetric incentive reward. Such an approach creates conservation incentives that benefit farmers and circumvent political resistance. Pilots in India’s Gujarat and Punjab provinces produced mixed evidence of the impact on pumping rates. Regardless, additional approaches should be considered and evaluated through field experiments in diverse settings.
There is wide acknowledgement that formal and informal water markets tend to improve efficiency by reallocating water toward uses that are more highly valued, which can be a useful risk-management tool for farmers – though there might be distributional and environmental concerns that warrant safeguarding (Nauges & Wheeler, 2024). Water markets allow farmers to adapt to changing circumstances through water reallocation in response to seasonal conditions. Since they involve voluntary exchanges between sellers and buyers, they reflect the real opportunity costs of water to users.
However, less than 1% of freshwater withdrawn worldwide is traded on markets (Rafey, 2023). This might reflect the high transaction costs of establishing official water markets. Formal water markets require onerous conditions – such as adequate legal and governance structures, costly infrastructure to transfer water from buyers to sellers, and enforcement mechanisms – and hence are limited to developed economies, as in Australia, China, Chile, Spain, and the US.[1] Meanwhile, informal water markets seem pervasive, especially in Asia. But there has been resistance to water markets from those who view water as a resource too valuable to trade (Bakker, 2007). Experience also suggests that markets might bring risks associated with rent capture, imperfect competition, and severe environmental externalities. However, these obstacles are not insurmountable and can be overcome with appropriate market design and trading rules.
Systematic economic forces can cause the best-intentioned policies and investments to fail. The history of water infrastructure abounds with such instances of policy disappointments.
Historically, water scarcity has been managed through infrastructure interventions, such as water storage and the transfer of water within and across river basins. But when supply is increased without corresponding incentives and safeguards to manage use, demand rises to meet the new level (Hornbeck & Keskin, 2014; Zaveri et al., 2020). The provision of free water signals that it is economically abundant when, in fact, it is physically scarce in arid areas. Farmers respond to economic signals rationally by using more water, amplifying the impacts of water scarcity – an example of the ‘paradox of supply’.14
Another approach to improving the efficiency of water use is the dissemination of water-saving or water-efficient practices and technologies. Adoption of these can be encouraged through subsidies or informational campaigns. One example is the Indian government’s Pradhan Mantri Krishi Sinchayee Yojna (PMKSY) program, which offers substantial subsidies for the purchase of micro-irrigation such as drip and sprinkler irrigation.
The adoption of improved technologies can be hampered by a range of constraints and market failures, especially but not only in developing countries. There is a need for policy intervention to boost technology adoption, especially where these confer external benefits.
Programs that subsidise the adoption of resource-saving technologies are criticised on several grounds. First, they might reward users who would have adopted the technology even without the subsidy – i.e., fail to achieve additionality – and might be subject to elite capture or disproportionately benefit socioeconomically better-off farmers. Second, when they are not accompanied by price signals or constraints on the use of the resource, adoption of the technologies might have rebound or Jevons effects. Additional evidence is needed to determine the package of policies needed to address these issues.
Achieving the 3Es calls for recognising the power of economic incentives to generate benefits from the use of water, address the risks that arise from water stress and correct externalities such as water pollution. It also calls for complementary approaches that shift from a focus on fixing problems after the damage has been done, to avoiding problems from occurring in the first place. Prevention is typically more cost effective than the cure, which suggests the need to shape markets to use and allocate water more efficiently, equitably, and sustainably from the start.
The Global Commission on the Economics of Water is an independent commission. The co-chairs and the Commissioners each contributed in their personal capacities. The co-chairs took final responsibility for the contents of the Report, while Commissioners contributed actively with substantive inputs and comments. The outputs of the Global Commission (reports, executive summary, infographics, other communication materials) do not necessarily reflect in their entirety the views of the respective Commissioners or those of their respective institutions.