Chapter 02

The
hydrological cycle as a global common good

Key takeaways

The growth of consumption and linked changes in land use and pollution are impacting the quantity and quality of freshwater resources. Climate change, deforestation, and loss of biodiversity are mutually reinforcing drivers of shifts that are changing precipitation patterns— the source of all freshwater— and destabilising the hydrological cycle.

Current policy tends to deal with the “blue” water we can see – in rivers, lakes, and aquifers – largely overlooking “green” water – in soil, plants, and forests – that evaporates and transpires into the air, falling downwind as rain.

Green water supplies are far more interdependent than previously thought. Atmospheric moisture flows carry water from one country to another, even across continents and oceans.

We are failing to connect the feedback between land cover and rainfall as a critical component of the global hydrological cycle. Nearly half the rain that falls over land originates from the land through a process of “terrestrial moisture recycling”. Intact ecosystems and lands managed in ways that do not adversely impact their hydrological functioning are critical to securing terrestrial rainfall. A stable supply of green water in soils is also crucial for carbon sequestration.

The hydrological cycle is deeply interlinked with climate change. As global temperature rises, land and oceans respond by evaporating more freshwater, and the hydrological cycle intensifies, leading to more extreme weather events that affect billions of people.

Multiple signs are pointing to a global freshwater crisis. We have transgressed planetary boundaries for global blue and green freshwater. Regional and local scales face multiple crises in terms of water quantity and quality. Combining information on total terrestrial water storage with indicators of water shortage and physical scarcity reveal “hotspots” of particular concern.

We therefore need to:

Reframe the hydrological cycle as a global common good as, i) the hydrological cycle renders countries and communities interdependent regionally and globally; ii) the hydrological cycle is deeply interlinked with the climate and biodiversity crises; iii) water plays a direct or indirect role in achieving all the Sustainable Development Goals.

Value blue and green water for the essential services it provides.

Put absolute limits on the amount of blue water that can be safely and sustainably consumed.

Manage green water in a way that acknowledges the feedback between climate change, land cover change, and precipitation. Conserve, restore, and sustainably use ecosystems – especially rainforests and wetlands – whose evapotranspiration is the source of rain at global scales.

Elevate the role of water in national strategies to mitigate climate change and biodiversity loss.

Humanity is deep into the Anthropocene, with human actions as the main pressure on our planet, impacting the global hydrological cycle and freshwater availability around the world. But global water crises go well beyond human suffering from shocks like droughts and floods, or the growth in the number of people using unsafe and insufficient water. Almost half of the world’s population faces some degree of water scarcity, and freshwater will determine whether the United Nations (UN) Sustainable Development Goals (SDGs) are possible to achieve.

While we must address how to manage and allocate freshwater fairly and efficiently, science demonstrates two additional threats to human development. First, we are pushing the water cycle out of balance – beyond the natural bound of variability we have known for the last 12,000 years – changing precipitation patterns, which are the source of all freshwater. Climate change, deforestation, and loss of biodiversity are mutually reinforcing drivers of shifts in the stability of freshwater runoff flows and vapour fluxes, which in turn determine future rainfall.

Second, freshwater provides for the stability of environmental systems on land and thereby the global economy. Without freshwater, there can be no photosynthesis, no biomass (food or fibre) production, no biodiversity, and no land-based carbon sequestration. Further, landscapes tend to burn when they dry out, impacting humans and other species, and increasing greenhouse gas (GHG) emissions. In short, stable freshwater is a prerequisite for economic and ecological resilience at ecosystem, biome, and planetary scale. This makes water a systemic challenge requiring collective, global action and transformations in how freshwater is governed and managed.

We have overused and polluted water resources for generations, causing great injustices to people and other species. Surface water and groundwater bodies are managed as if they are local only and stable year after year, factoring in only natural variability based on historic data. This premise no longer holds. Under growing pressure from human activity, the hydrological cycle is increasingly out of balance in individual countries and regions and on a global scale.

Current approaches to water policy tend to deal with the “blue” water we can see – in rivers, lakes, and aquifers – largely overlooking “green” water – in soil, plants, and forests. Green water evaporates and transpires into the air and recycles through the atmosphere, generating around half of all rainfall on land, the source of all freshwater. Countries are thus connected not only through flows of blue water such as rivers, but also through atmospheric flows of moisture sourced from green water flows from land. We are failing to connect the feedback between land cover and rainfall generation as a critical component of the global hydrological cycle.

A stable supply of green water in soils is crucial to sustaining the natural land-based ecosystems which in turn absorb 25-30% of the carbon dioxide emitted from fossil-fuel combustion (Friedlingstein et al., 2023). This process represents one of the most significant ecosystem services to the global economy. Yet the loss of wetlands and soil moisture, and deforestation are depleting the planet’s carbon stores, with consequences for climate change. Rising temperatures trigger extreme heat waves and increase evaporative demand in the atmosphere, which dries landscapes and heightens the risk of wildfires.

The water crisis impacts virtually every one of the SDGs and threatens people everywhere. The challenge of producing enough food for a growing world population, accelerated spread of diseases, uninhabitable urban areas, and increased forced migration and conflicts are just a few of the predictable and unjust outcomes.
Understanding blue and green water

Freshwater is the “bloodstream” of the biosphere. The global hydrological cycle provides the basis for all life, enabling carbon cycling through the production of biomass, regulating the climate, and carrying nutrients, chemicals and pollutants (Steffen et al., 2015; Gleeson et al., 2020; Wang-Erlandsson et al., 2022).

The global hydrological cycle is the movement of water on, above, and below Earth’s surface. This continuous flow of water is driven by solar radiation and gravity, with water shifting between its physical phases of liquid, gas (vapour) and solid (frozen), and moving between land, oceans and the atmosphere. Water enters the atmosphere either through evaporation from land and water bodies, transpiration from vegetation or evaporation from oceans, where it is then transported as vapour, condensates, forms clouds, and eventually precipitates again on the Earth’s surface as rain, snow and hail.

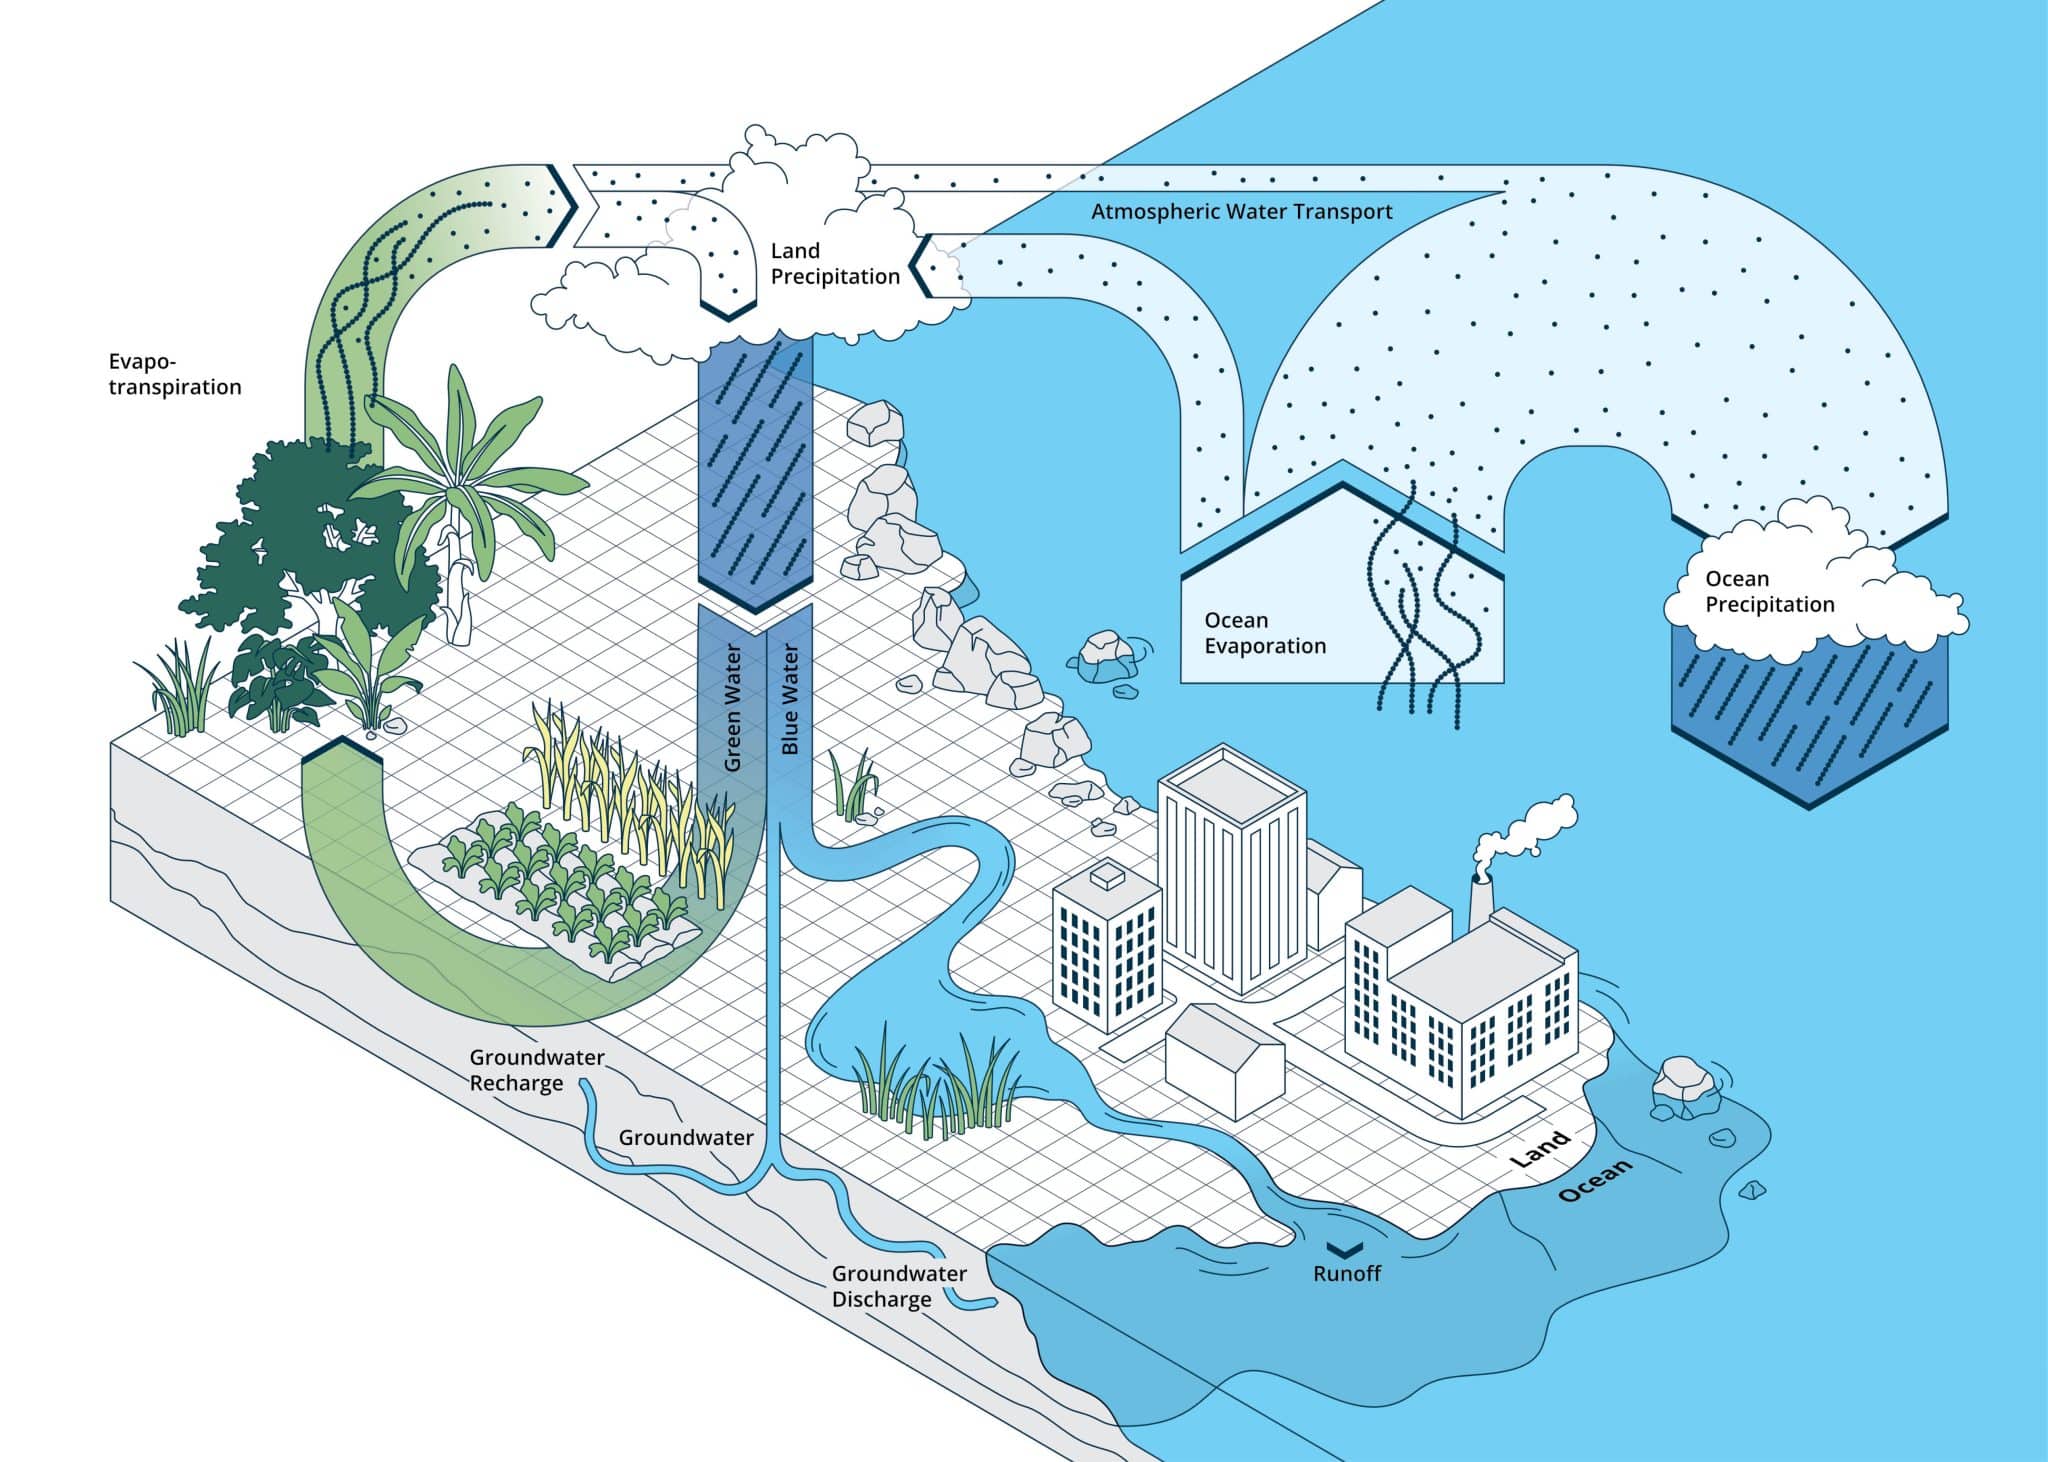
Precipitation is the source of freshwater. Once precipitation falls on land, it can be broadly categorised as blue or green (Figure 2.1). When rain falls on land, it either infiltrates into the soil, creating soil moisture (green water), evaporates directly from the land surface (from the canopy cover, soil or standing water ponds), or flows as surface runoff (blue water) in rills and gullies, feeding rivers and wetlands. Part of the infiltrated green water is taken up by plants, returning to the atmosphere via transpiration (green flow). Water that seeps beyond the root zone in the soil reaches the water table, and eventually deeper layers of groundwater (blue water resource). This groundwater recharge is also in continuous movement, feeding the sub-surface flow of blue water to rivers, lakes, and estuaries.

It is important to distinguish between blue/green water stocks and flows. Blue water stocks are stored in lakes, behind dams, below the water table in aquifers, and in ice, glaciers and snow. Blue water flows form runoff in rivers and sub-surface recharge of water tables and groundwater. Similarly, green water stocks are moisture in the root zone of soils and the water held in plants, while green water flows are vapour released as transpiration and evaporation. Blue and green water stocks and flows are interconnected: river water (blue flow) pumped from a reservoir (blue stock) to an irrigated field creates soil moisture (green stock), which turns into evaporation from the ground and transpiration from crops (both green flows).

Blue water is the basis for all aquatic ecosystems, including wetlands, and is available to humans as an extractable resource. Green water, which is available to plants, supports all terrestrial ecosystems and rainfed agriculture. On global and annual scales, approximately 60% of the precipitation that falls on land goes to green water and 40% to blue water, meaning green water constitutes the majority of freshwater on land (Douville et al., 2021).

Blue water can become “grey” if it is polluted. Increasing water pollution means that a growing share of available water resources is unfit for human use and has a significant detrimental impact on freshwater ecosystem health, reducing the ability of these ecosystems to generate ecosystem services (Box 2.1). Poor water quality is a major challenge in the Anthropocene, negatively impacting economic growth, human potential, and reducing food production (Damania et al. 2019).

Figure 2.1: A simplified illustration of the hydrological cycle

Note: The main global freshwater flows are depicted with proportional arrows according to volume estimates in the latest IPCC AR6 Assessment (Douville et al., 2021): land precipitation is 120,000 km3/yr (+/- 10%), which is partitioned 60% to green water and 40% to blue water; ocean precipitation is 424,000 km3/yr (+/- 10%), land evapotranspiration is 74,000 km3/yr (+/- 10%), ocean evaporation is 470,000 km3/yr (+/- 10%), ocean to land atmospheric water transport is 46,000 km3/yr (+/- 10%), groundwater recharge is 13,000 km3/yr (+/- 10%). Source: Figure by GCEW.
Blue and green water both evaporate from bodies of surface water (blue), soil and vegetation (green), while green water also transpires from plants as a product of photosynthesis. Evapotranspiration refers to combined evaporation and transpiration. Rising temperatures increase both the atmosphere’s water demand and its capacity to hold water. Water supplies are thus connected to Earth’s energy balance: land and oceans respond to global warming by evaporating more water. Moreover, as water traps heat, more atmospheric water vapour leads to more warming and more evaporation.

The continuous exchange of moisture between the land and the ocean via atmospheric water transport is analogous to blue water flowing in streams over land according to topography, though atmospheric water flows according to wind patterns and pressure gradients. And like blue water ultimately discharges into a lake or ocean, atmospheric moisture ultimately falls on the land or ocean surface as precipitation.

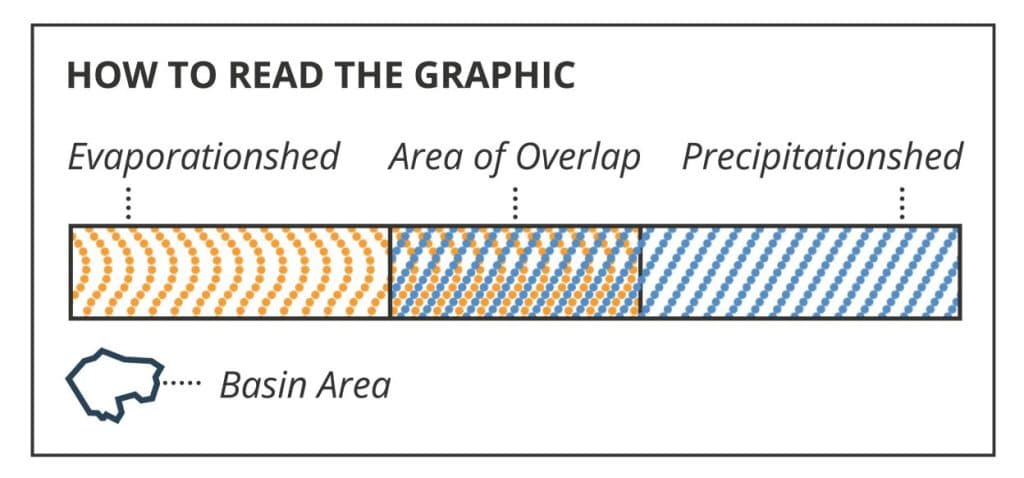
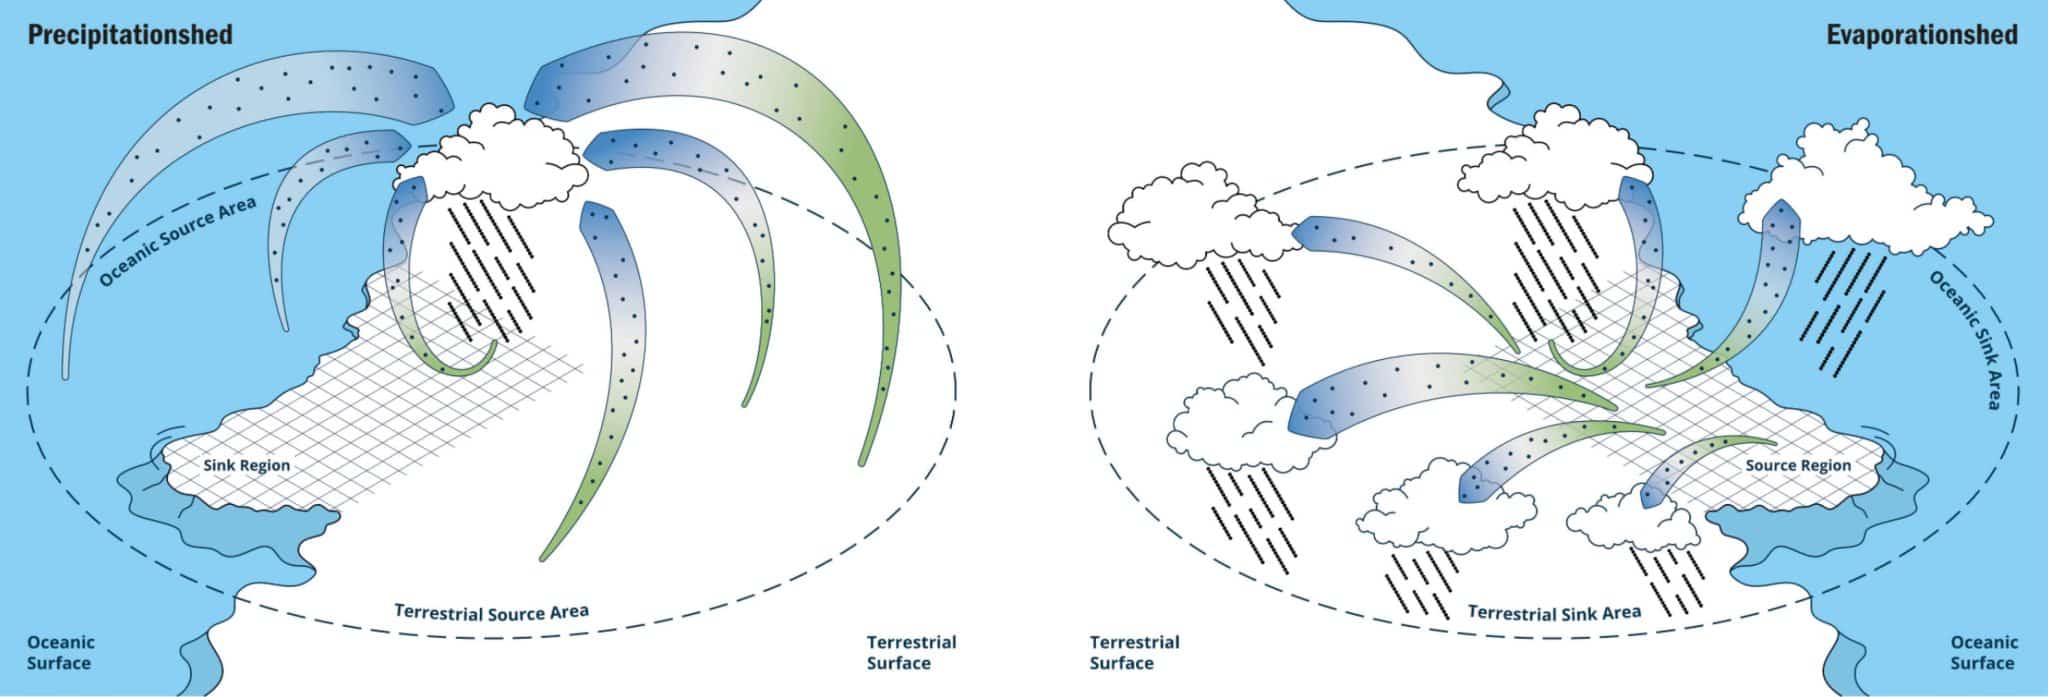
The spatial extent of a given area’s precipitation source area (where does the rain come from?) and evapotranspiration sink area (where is the green flow exported to, contributing to new rainfall?) can be delineated like watersheds on land. A precipitationshed includes all the ocean and land areas whose evapotranspiration contributes to an area’s precipitation, whereas an evaporationshed includes all the ocean and land areas that receive precipitation from an area’s evapotranspiration (Figure 2.2).

Figure 2.2: Precipitationsheds and evaporationsheds

Note: Conceptualisation where precipitation in the sink region originates from both terrestrial and oceanic sources of evaporation, likewise, evaporation in the source region ends up in both terrestrial and oceanic sink regions as precipitation. Source: Figure by GCEW, adapted from Keys et al., 2012.

Terrestrial moisture recycling (TMR) describes moisture originating over land that contributes to precipitation also over land, (i.e., land-to-land rainfall, generated on land, transported downwind, and falling on land). Moisture originating in an area that reprecipitates in the same area is called internal moisture recycling (i.e., the source and sink regions are the same). When that area falls within the same country, it is domestic moisture recycling. These atmospheric moisture flows can be simulated by moisture-transport models that track precipitable moisture at the grid scale from its source region as evaporation or evapotranspiration to its sink region as precipitation (Tuinenburg & Staal, 2020; van der Ent et al., 2014).

Though green water flows from land represent a local and immediate water loss to the air, much of it eventually returns to land somewhere as part of the terrestrial water cycle. For decades, general circulation models estimated that 40-60% of terrestrial precipitation is sourced from land, with the remainder coming from ocean sources (Douville et al., 2021; van der Ent et al., 2010). More recent moisture tracking research narrows that estimate to approximately 45% land sources and 55% ocean sources (De Petrillo et al., 2024). Therefore, nearly half of terrestrial rainfall is sourced from land, meaning green water flows are just as critical as ocean evaporation for sustaining precipitation (the source of all freshwater). Green water must therefore be managed in a way that acknowledges the feedback between climate change, land-cover change, and precipitation. Ecosystems whose evapotranspiration is the source of rain at regional scales – especially rainforests (Avissar & Werth, 2005; Werth & Avissar, 2002) and wetlands (Ramsar Convention on Wetlands, 2018) – should be conserved, restored, and sustainably used.

Box 2.1 The growing water pollution crisis

Water pollution is increasing globally and becoming more complex. More stringent water quality regulation and significant investments in wastewater treatment (primarily in high-income countries) have led to localised improvements, with major river clean-ups for example on the Han River in Korea, on the Jucar and Segura rivers in Spain or on the Rhine or the Danube in Central Europe. However, these improvements are outweighed by the fact that pollution loads have accumulated in water bodies and soils over the past centuries.

Beyond pollution, attention needs to be paid to the hydro-morphology of water bodies, which sits at the interface between land, freshwater and ecosystems. Few policy initiatives consider it. The European Union’s Water Framework Directive is an exception.

Water pollution aggravates water scarcity. Clean water scarcity (defined as the availability of surface water with acceptable quality) affects 55% of the global population for at least one month each year, compared to 47% when only water quantity parameters are considered (Jones, Bierkens, & van Vliet, 2024). Clean water scarcity is projected to rise globally, to between 56% and 66% of the global population by the end of the century (Wang, et al., 2024). Water contamination is projected to aggravate water scarcity in over 2000 sub-catchments worldwide by 2050 (Wang, et al., 2024).

The impacts of poor water quality on health, ecosystem integrity and economic sectors are significant but not well known in aggregate. Moderately polluted rivers (using biological oxygen demand as proxy) can reduce downstream economic growth by 1.4%; heavily polluted rivers have an even higher impact of 2% economic growth reduction downstream; with the highest impacts estimated in middle income countries (Russ, Zaveri, Desbureaux, Damania, & Rodella, 2022).

Climate change is highly likely to put additional pressure on the quality of water resources and freshwater ecosystems. Trade-offs between environmental, societal, and economic objectives to meet water quality objectives will intensify (Wang et al., 2024). Typically, addressing diffuse pollution from agriculture will require considering trade-offs between food security, biodiversity, and climate adaptation and mitigation.

Siloed legislative spheres governing pollutants limit the toolbox of water regulators and the effectiveness of water pollution management. Current environmental water quality standards may no longer fit for purpose, for example in factoring in the impact of chemical mixtures and low doses of substances (Kortenkamp, et al., 2019). Innovative policy responses are burgeoning. Water quality regulation based on effects, rather than on specific substances, is being pioneered by the California State Water Board to guarantee the safety of recycled wastewater (SCCRWP, 2014). New and improved data, as well as advanced water quality monitoring methods, are crucial for understanding and addressing water quality-related risks.

Justice should drive policy responses. For instance, the Polluter Pays principle makes polluting activities costly. As an illustration of an innovative application of the Polluter Pays principle, the European Commission is looking to transfer some of the cost of water treatment to the chemical and cosmetics industry through an extended producer responsibility scheme, reflecting their share in the pollution of water streams (European Commission, 2022).

Identifying freshwater boundaries

Due to the fundamental role of freshwater in the Earth system, the global freshwater cycle is included as one of nine planetary boundaries (PB). The concept of planetary boundaries is one of the analytical frameworks used by Earth-system scientists to define a safe operating space for humankind (Richardson et al., 2023; Rockström et al., 2009; Steffen et al., 2015).

Recognising that adherence to the biophysical limits of the global freshwater cycle does not necessarily achieve water justice; freshwater is also defined by the Earth Commission in terms of safe and just Earth-system boundaries (ESB) (Rockström et al., 2023; Gupta et al. 2024; Stewart-Koster et al., 2023). The Earth-system boundaries framework includes standards to govern the quality of water; these standards have been violated in many parts of the world (Gupta et al., 2023). Both frameworks express freshwater boundaries in terms of blue and green water, using streamflow (blue), soil moisture (green), and groundwater recharge (blue) as indicator variables. Their safe limits are quantified with ecosystem functioning in mind, considering boundary transgression in terms of wet and dry limits. This aligns with thinking in Turning the Tide (Mazzucato et al., 2023) and The What, Why and How of the World Water Crisis (GCEW, 2023), recognising that water impacts on societies and the economy generally stem from extreme events causing too much, = too little or too dirty water.

The Earth-system boundary framework aims to express safe and just dimensions of freshwater variables in the same unit, and includes only blue water variables (i.e., streamflow and groundwater recharge) in its first phase due to the challenge of quantifying green water in the justice dimension. Across both frameworks and according to all freshwater boundary control variables, freshwater limits are currently transgressed globally (Table 2.1) (Stewart-Koster et al., 2023; Wang-Erlandsson et al., 2022; Porkka et al., 2024; Richardson et al., 2023). The Earth-system boundaries framework includes standards to govern the quality of water; these standards have been violated in many parts of the world (Gupta et al., 2023).

Table 2.1: Freshwater boundaries as depicted by the planetary and Earth system boundary frameworks

Freshwater system

Boundary definition

Safe level

Status

Blue water

PB: Percentage land area globally with stream flow deviating from pre-industrial variability (dry/wet) defined by 5th/95th percentile at 0.5° grid level

< 10% global land area

ESB: Surface water flows; collapse of aquatic ecosystems

<20% monthly water flow alteration on 100% of land area

ESB: Collapse of groundwater-dependent ecosystems

Average drawdown does not exceed average annual recharge

Green water

PB: Percentage land area globally with soil moisture deviating from pre-industrial variability (dry/wet) defined by 5th/95th percentile at 0.5° grid level

< 11% global land area

Notes: PB = planetary boundary, ESB = Earth-system boundary. The status column indicates transgression levels, where yellow indicates rising risk, and red indicates transgressed. Source: Richardson et al. 2023 (for PB); Stewart-Koster et al., 2023 (for ESB).

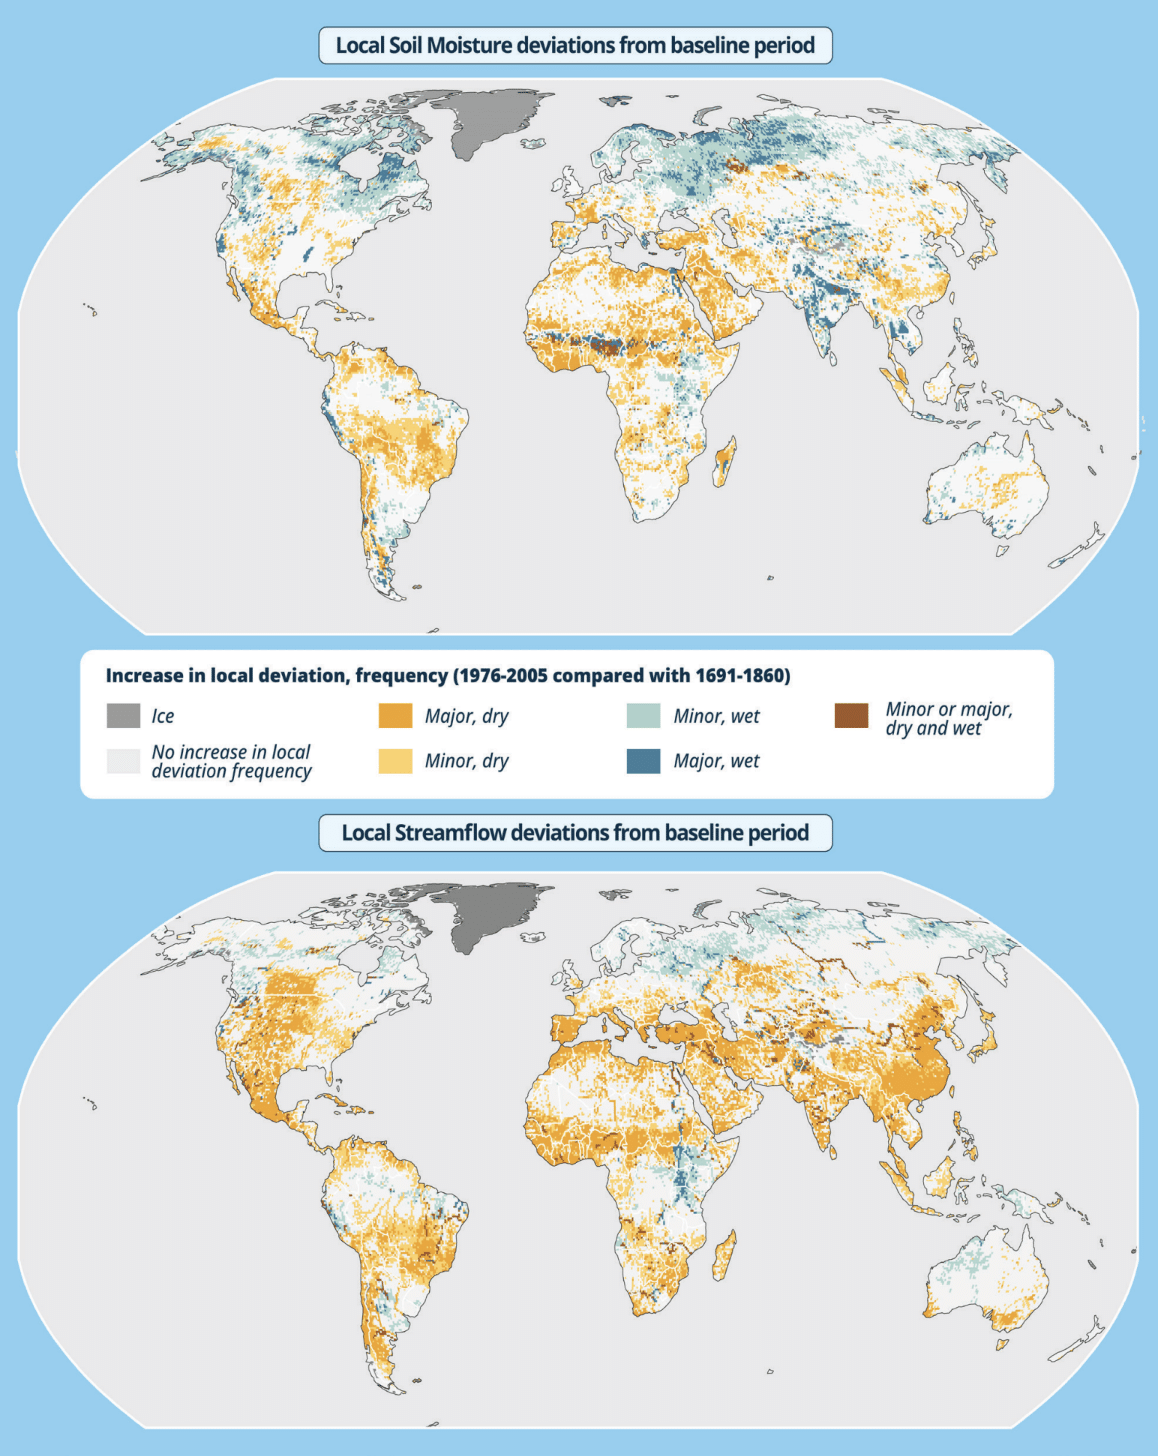
According to the freshwater planetary boundary definition, Figure 2.3 shows land areas that have major and minor wet or dry deviations in streamflow and soil moisture compared to baseline conditions. Every continent and all major basins experience either too much or too little blue or green water. The significant changes in soil moisture are mostly tied to rising temperatures. Boreal zones are experiencing major wet deviations in soil moisture due to melting permafrost and ice, while the central Africa/Sahel region is experiencing major dry deviations in soil moisture due to extreme heat drying the soils. The significant changes in streamflow are mostly tied to human water use, dominated by major dry deviations in streamflow around the world. Instances of wet deviations in streamflow are mainly due to accelerated melting of permafrost and ice.

The degree and extent of freshwater transgressions is particularly worrying, as the other planetary boundaries that influence and interact with freshwater – climate change, biodiversity, nutrient flows, and land-system change – are all breached too (Richardson et al., 2023). Earth is losing the ability to keep environmental and water conditions stable and conducive for human development. Blue and green water both need to return to a safe operating place within planetary boundaries, with the necessary transformations to occur in a just operating space for Earth-system boundaries.

Transgression of global freshwater boundaries alone is not evidence of a global water crisis. However, it indicates that the Earth system is losing resilience and that we are at increasing risk from an intensified and therefore less stable water cycle.

Figure 2.3: Status of the freshwater planetary boundary variables

Notes: Statistically significant increases and decreases in dry and wet local deviation frequency for streamflow (top panel) and soil moisture (bottom panel). Changes in the frequency of local deviations are computed by comparing ensemble median frequency of local deviations (1976-2005) against a pre-industrial reference period. The changes are classified on the legend as (1) minor changes, wet or dry, (2) major changes, wet or dry, and (3) changes at a location where both wet and dry changes occurred, irrespective of minor or major. Source: Figure by PIK, data from Porkka et al. (2024).

The stage for a global water crisis

We live in a world of both more frequent and extreme water-related disturbances and of life-supporting systems losing water resilience. We feel the impact on the hydrological cycle and its interactions with atmospheric dynamics, with increasing frequency and severity of droughts and floods around the world. Through climate and land-use change, and unsustainable water use, human-made pressures are pushing the global hydrological cycle out of balance.

While we are breaching boundaries at the global level, regional and local scales already face multiple crises in terms of water quantity and quality. Some 1.4 billion people live in so-called closed river basins, where demand exceeds blue water supply, and there is no longer enough water to meet social and environmental needs (Falkenmark & Molden, 2008; Molle et al., 2010).

Each degree of global warming amplifies projected water availability changes and water-related risks. The last Intergovernmental Panel on Climate Change (IPCC) Report (AR6, Chapter 4) reveals the stark reality in terms people suffering under an intensified global hydrological cycle (Caretta et al., 2022):

  • 4 billion people are estimated to experience severe water scarcity for at least some part of the year.
  • 3-4 billion additional people are projected to be exposed to physical water scarcity at 2-4°C of global warming, respectively.
  • 500 million people live in areas now wetter than normal and about 163 million live in areas now drier than normal (i.e., where long-term average precipitation is high or low, respectively).
  • 709 million people live in regions with higher precipitation intensity, whereas 86 million live in areas with lower precipitation intensity (i.e., where annual, maximum, one-day precipitation has increased or decreased, respectively, since the 1950s).
Water scarcity, shortage, and stress

Water scarcity describes a lack of water regardless of the reason, though usually connected to physical and natural limitations, as in arid regions and during prolonged drought. Aridity indices, which reflect the climatic degree of dryness of an area, are simple and effective indicators of physical water scarcity. For example, the ratio of average precipitation divided by potential evapotranspiration (P/PET) indicates regions with higher atmospheric demand for water than is available from precipitation, classified as index values of <1. Almost 40% of global land area is under hyper-arid to semi-arid conditions, classified as index values of <0.5 (Figure 2.8d). These areas are prone to physical water scarcity regardless of demand or use efficiency.

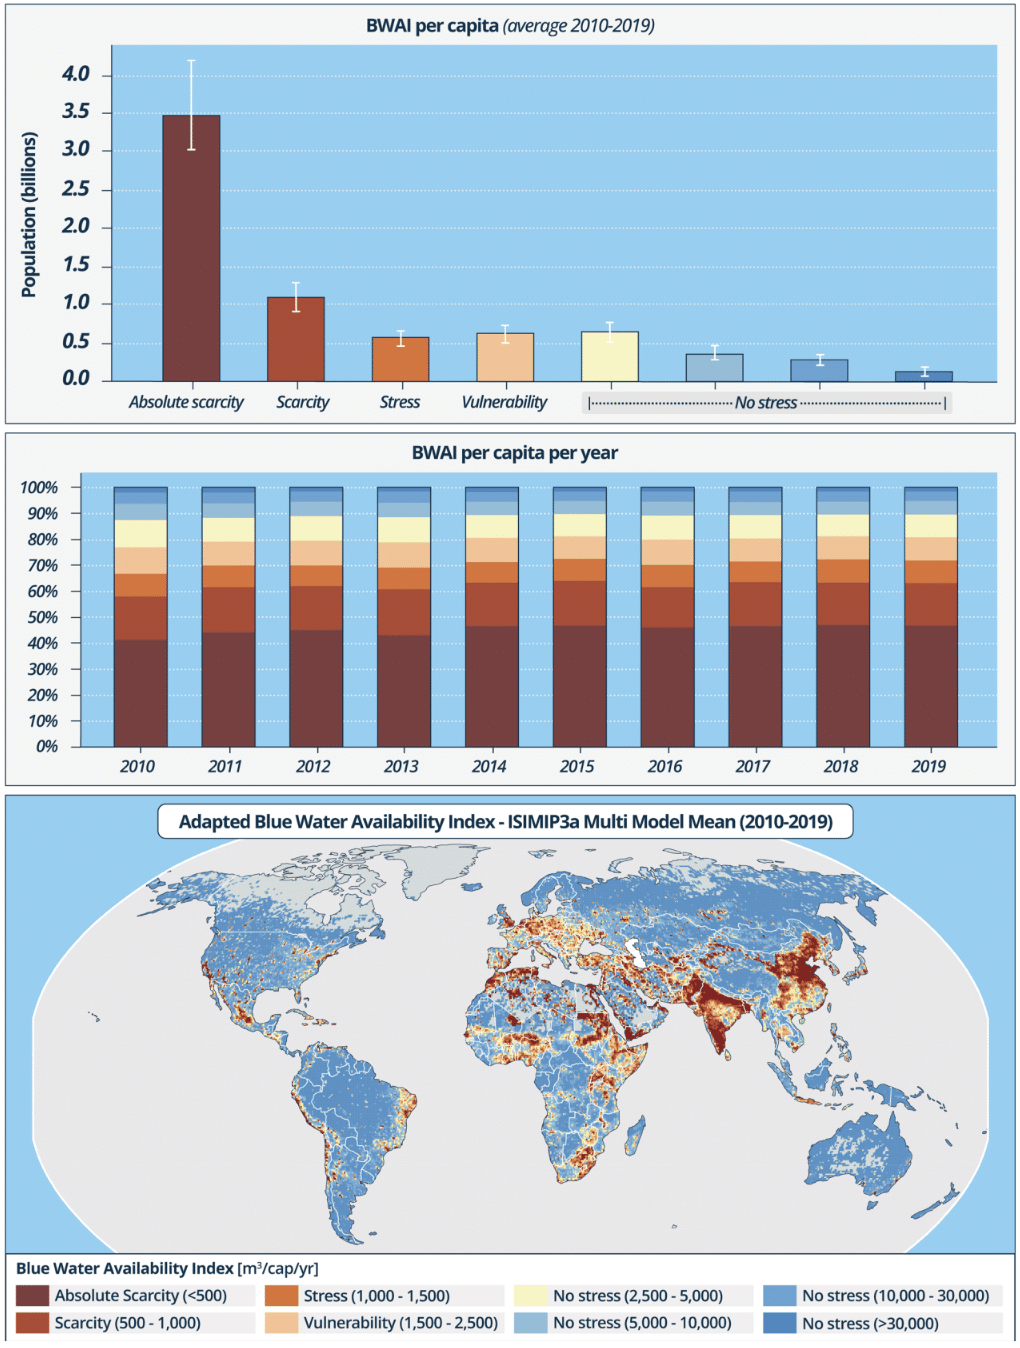
In contrast, water shortage refers to consumption-driven physical shortfall as assessed against principal water requirements, whereas water stress is gauged by how much of the available freshwater supply is needed to meet demand in a period, and can be connected to accessibility problems (e.g. UN Water, 2024). The Falkenmark Index (FI) introduced in 1989 (Falkenmark, 1989) measures blue water stress based on the number of people competing for a unit of flow (i.e., water crowding), showing per-capita availability. In its original form the FI blue water stress thresholds focus on basic human water needs, where available blue water equates to a country’s total available annual runoff, less the 30% allocated for environmental flows that sustain aquatic ecosystem functioning. Here, we adapt the FI for water stress to a broader blue water availability index (BWAI), with thresholds for different levels of water scarcity reflecting increasing blue water sufficiency, and perform the analysis at both country and grid scales. Figure 2.6 provides an updated BWAI assessment at local (grid) scale, utilising the most recent ensemble of global hydrological modelling outputs  over the historical period 2010-2019 (see methods and country scale results in Appendix 2.1).

Despite natural variability over time, the trend over the last decade is clear: approximately 70% of the world population (over 5 billion people) live under local blue water stress or worse, with about 4.5 billion people under blue water scarce conditions – and these numbers are only rising due to increasing population. If available blue water is assumed to be accessible equally to the entire population at country scale, 50% of the world population would still be living under blue water stress or worse, with about 1.5 billion people still under scarce conditions (Appendix 2.1). The grid scale BWAI reflects availability according to local runoff topology (e.g. Vörösmarty et al., 2000) assuming no water sharing or transfers, and will therefore reflect high water crowding in populated areas, whereas the country scale BWAI assessment spreads this demand to a wider area

Given that the water scarcity indices are based on per capita water availability, there are discrepancies between the geographical assessment of aridity (Figure 2.8d) and (human) blue water stress (Figure 2.4). For example, sparsely populated regions of northern Africa, though arid, are classified as “not stressed”, while densely populated parts of northern Europe, though humid, are classified as “scarce” or “stressed”, which comes down to how many people crowd the resource.

Figure 2.4: Population affected by blue water scarcity and stress

Notes: Blue water availability indicator (BWAI) in m3/p/y – absolute scarcity <500; scarcity 500–1,000; stress 1,000–1,500; vulnerable 1,500–2,500 – or into “no stress” classes reflecting increasing blue water sufficiency: 2,500–5,000; 5,000–10,000; 10,000–30,000 and >30,000. The global totals and percentages of people living under these blue water availability classes are shown in the top panel, with the spread among models on the mean over 2010-19 (left) and the multi-model mean over time (right). The bottom panel maps the BWAI at 0.5° grid scale averaged over 2010-19. Analysis is performed with output from the ISIMIP3a ensemble of global hydrological models (Frieler et al., 2024).

Assessing freshwater availability only in terms of blue water misses 60% of the total freshwater resource (green water). In terms of human water requirements, green water mainly relates to rainfed agriculture and is defined as the soil moisture available for productive moisture flow (evapotranspiration) from agricultural land.  Considering water requirements for food production, it is estimated that a total of 1,300 m3/person/year of evapotranspiration from blue and green sources is needed to produce a standard diet (Rockström et al., 2009). Of this, a minimum of 600 m3/p/y of productive transpiration (green water) is needed.

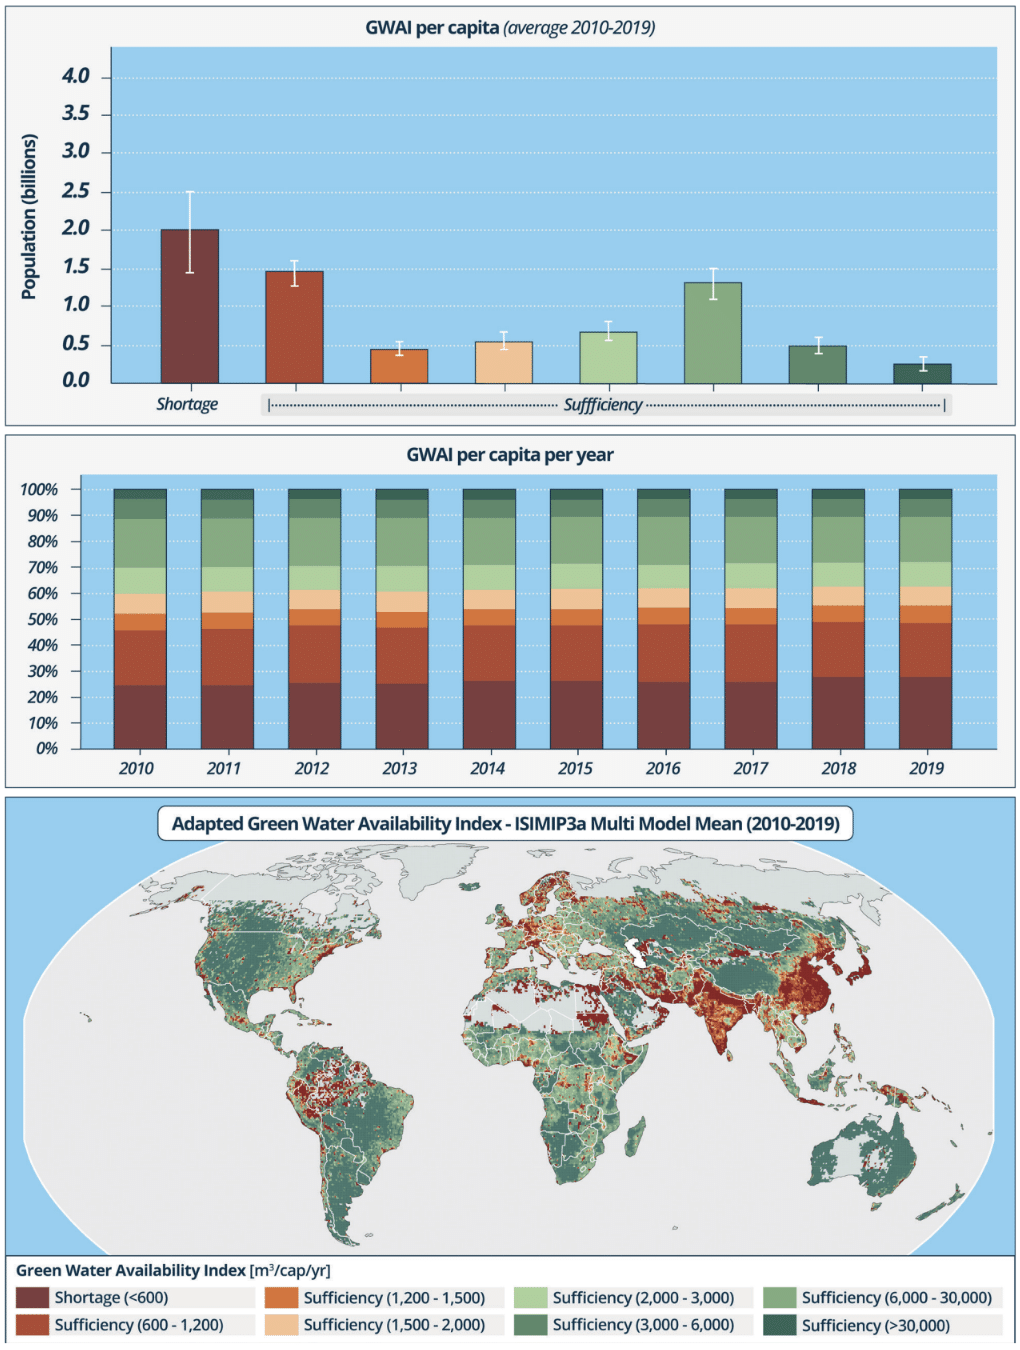
A green water availability index (GWAI) threshold can therefore be set at 600 m3/p/y evapotranspiration from rainfed agricultural land. Below this threshold corresponds to absolute green water shortage, at the threshold there is – theoretically – sufficient green water (assuming 100% transpiration efficiency), and above this threshold are levels of green water sufficiency given decreasing transpiration efficiency. In other words, when green water per capita is less abundant, producing a standard diet needs higher transpiration efficiency.

Figure 2.5 provides an updated green water availability assessment applying the GWAI at local (grid) scale (see methods and country scale results in Appendix 2.1). Approximately 2 billion people live under local green water shortage conditions, where green water resources are not sufficient to support adequate diets. Over 4.5 billion people live in areas where a transpiration efficiency over 40% would be required to produce adequate diets. Most of these people are likely living under green water shortage, given the global average transpiration efficiency on agricultural lands is 45% (Rockström et al., 2009). The remaining almost 3 billion people live in areas with green water sufficiency for producing adequate diets.

Figure 2.5: Population affected by green water shortage

Notes: Green water availability indicator (GWAI) based on productive green water flow (ET) from rainfed agricultural lands and permanent pasture lands (e.g. excluding forested/naturally vegetated lands), averaged over 2010-19, in m3/p/y. Green water shortage is <600 and green water sufficiency is >600, assuming various levels of transpiration efficiency that would be needed to produce an adequate diet, where 600 = 100% transpiration efficiency, 1,200 = 50%, 1,500 = 40%, 2,000 = 30%, 3,000 = 20%, 6,000 = 10%, and 30,000 = 2%. The global totals and percentages of people living under these GWAI classes are shown in the top panel (over the period 2010-2019), with the spread among models for each GWAI range (left) and the multi-model mean over time (right). Analysis is performed with output from the ISIMIP3a ensemble of global hydrological models (Frieler et al.; 2024).

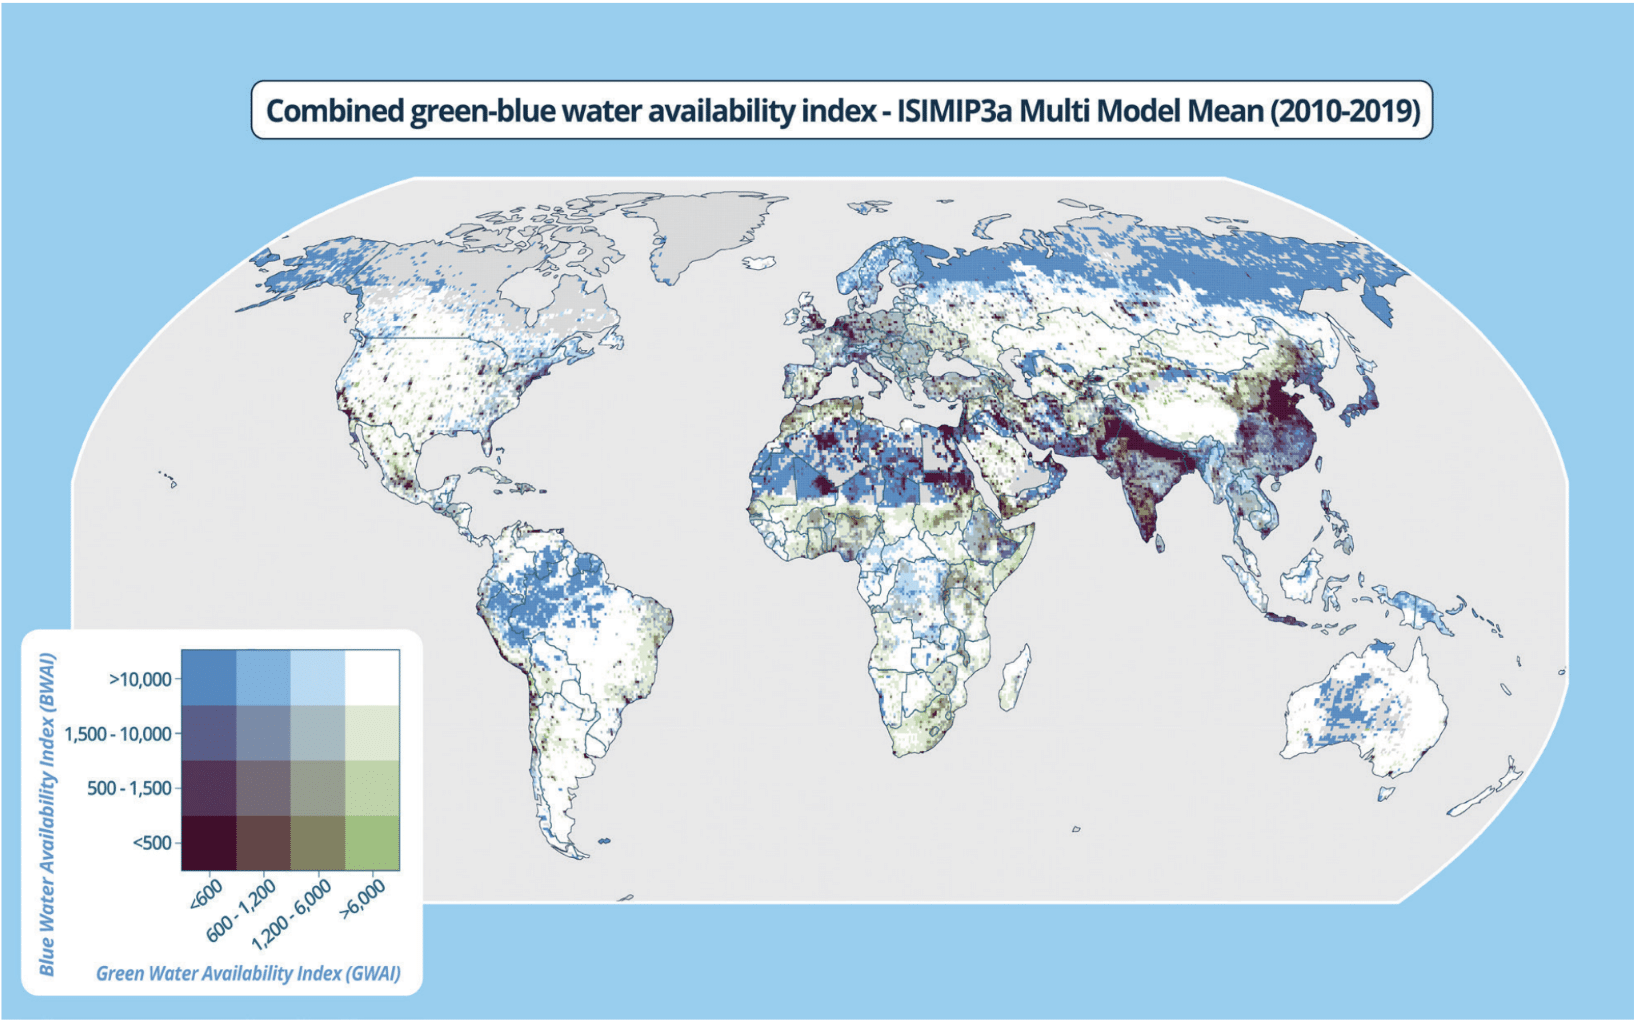
These green and blue water indicators can be combined into a green-blue water availability index (GBWAI) to compare the sum of green and blue water availability, allowing assessment across all dimensions of blue and green water shortage and sufficiency (Rockström et al., 2009). Figure 2.6 provides an updated green-blue water availability assessment at local (grid) scale (see methods and country scales in Appendix 2.1).

In principle, much of the world has sufficient water resources when considering combined blue and green water availability. Many regions are lifted out of absolute water scarcity based on blue water alone when adding green water to the equation, for example, in parts of Africa, China, the Middle East, and Europe. This underpins how critical green water is for rainfed agriculture in some blue-water-scarce regions, and thus the potential to generate adequate diets for their populations through sustainable water management.

Figure 2.6: Areas classified by levels of combined blue and green water availability

Notes: The map shows the dimension of green-blue water availability at grid scale averaged over 2010-19. In the two-dimensional legend, blue water availability is depicted vertically and green water availability is depicted horizontally. Absolute green and blue water scarcity is indicated with dark purple in the lower left, green water sufficiency under blue water scarcity is green in the lower right, blue water sufficiency under green water shortage is blue in the upper left, and blue and green water sufficiency is white in the upper right. Analysis is performed with output from the ISIMIP3a ensemble of global hydrological models.

The total terrestrial water storage, which covers blue water in rivers, lakes, groundwater, snow and ice, and green water stores as soil moisture, is an integrated indicator of water stocks supporting the global economy by supplying water to societies and industry, and providing water for all aquatic and terrestrial ecosystems as well as food and biomass production in rainfed and irrigated production. The water stored in water tables and deeper aquifers enable people to grow crops in places where rainfall is too limited or unreliable. This groundwater, which provides 49% of water withdrawn for domestic use worldwide and about 43% of all water withdrawn for irrigation (Rodella et al. eds., 2023), is a valuable resource amid climate change, as it does not change seasonally and does not evaporate like surface water during hot spells. But large numbers of aquifers are being rapidly depleted.

China and India rely heavily on groundwater to boost agricultural productivity through irrigation, depleting their stock. In India, the volume of water over-abstracted between 1996 and 2016 is estimated at around 120–200 km3 (Rodella et al. eds., 2023). Aquifer depletion can lead to land subsidence and salinisation. In China, land around major cities such as Beijing, Shanghai, and Wuhan is subsiding as aquifers are depleted to support agriculture and urban needs (Hasan et al., 2023). In Indonesia, the combination of sea-level rise and sinking land due to aquifer depletion has created severe flood risks (Renaldi, 2023).

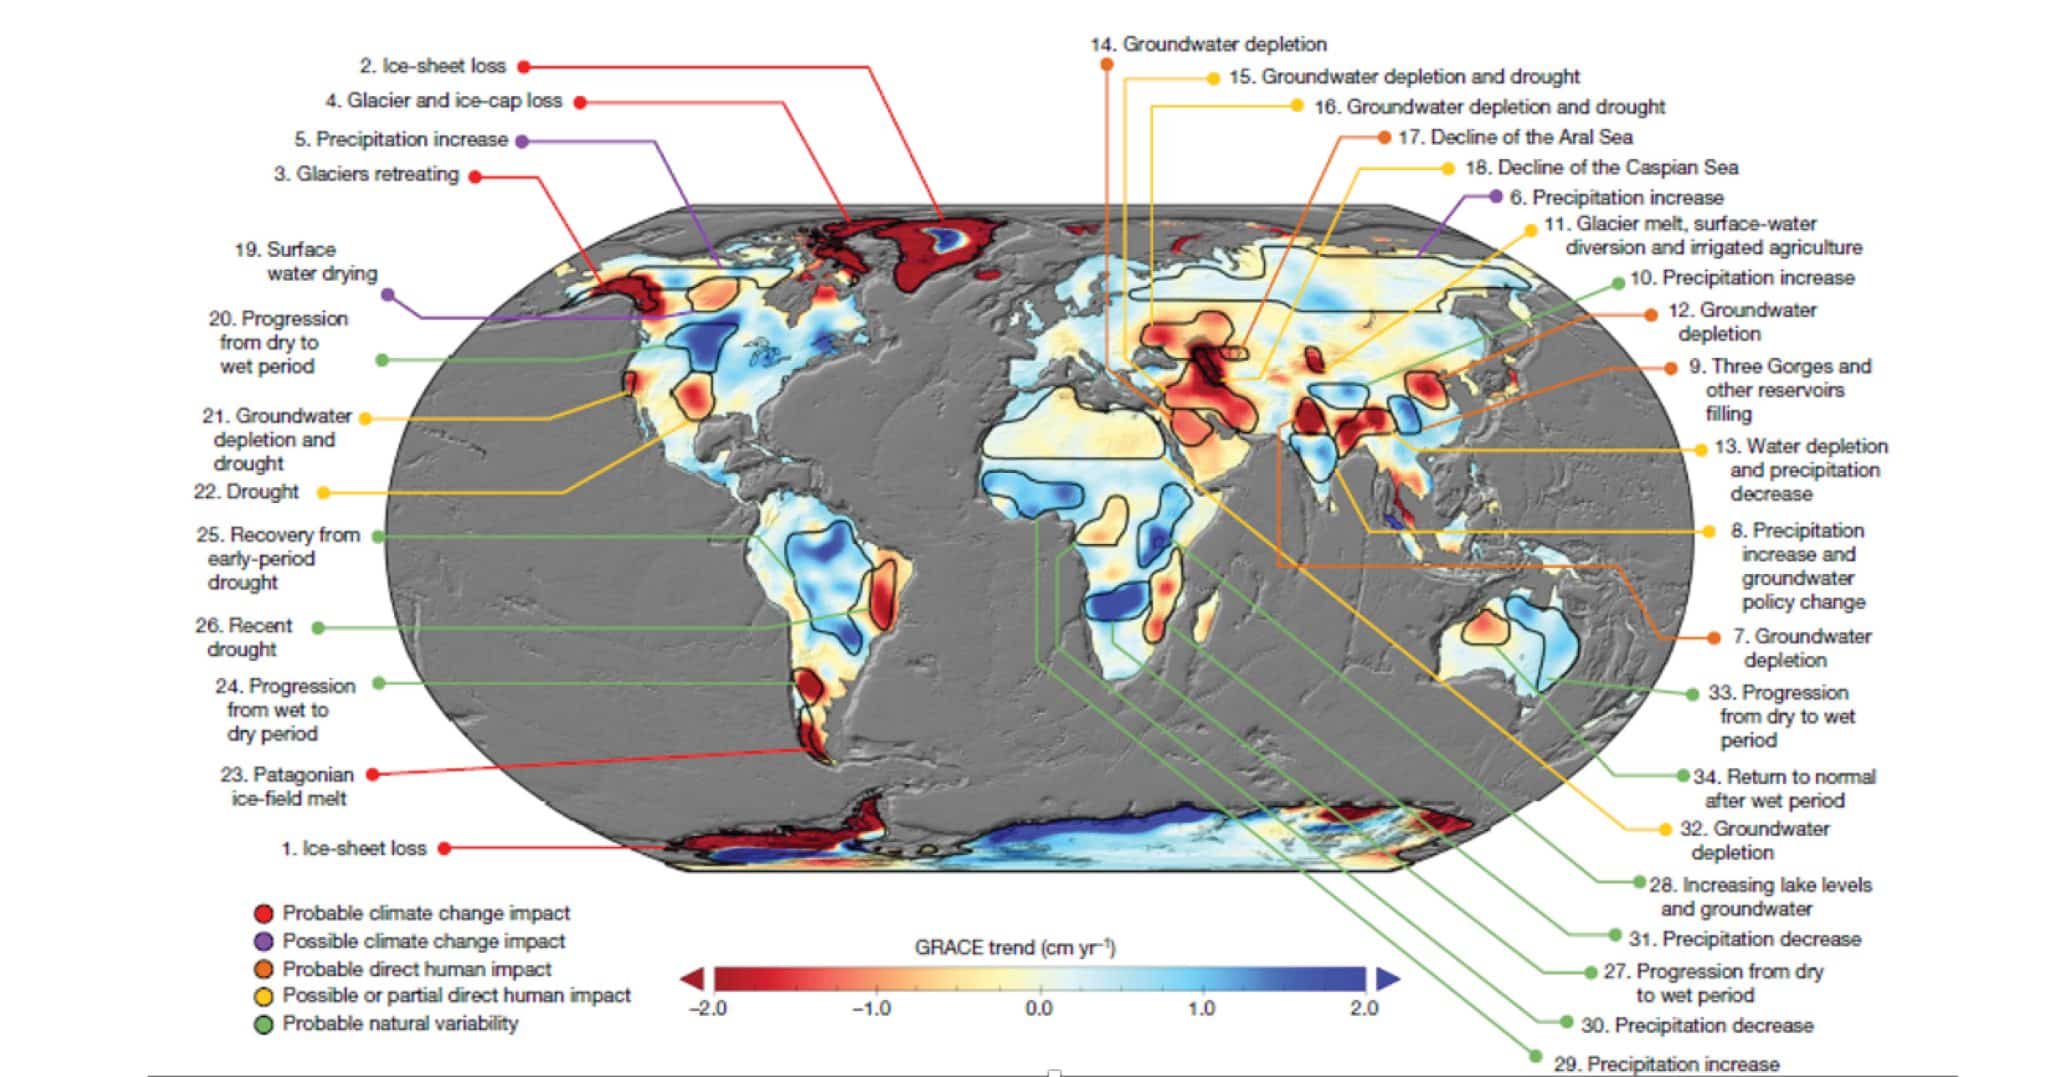
Scientists’ ability to measure the extent of groundwater depletion, water levels in lakes and rivers, soil moisture and changes to water stored in snow and ice has greatly improved in the last two decades thanks to the Gravity Recovery and Climate Experiment (GRACE) satellite missions, which can measure the total amount of water stored on and below the Earth’s surface (Güntner, n.d.).

Observed over time, it is possible to estimate changes in total terrestrial water storage, or how much water is lost or gained from a given region. Importantly, losses and gains are summed per slice of the Earth being measured, so it is also possible they cancel out to some degree. That said, the data from GRACE continues to be critical in understanding regional groundwater depletion, droughts and floods, and how water is distributed around the globe over time (Figure 2.7).

Figure 2.7: Annotated map of terrestrial water storage trends

Notes: Trends in total terrestrial water storage (cm/year) obtained based on GRACE observations from April 2002 to March 2016. The cause of the trend in each outlined study region is explained and colour-coded by category. Source: Rodell et al., 2018.

Total terrestrial water storage changes seasonally. In Central Europe, it rises in the winter with higher precipitation and lower evaporation rates, and drops in the summer. In the tropics, levels rise during the rainy or monsoon season and decline during the dry season. The satellites can also “see” the footprints of large floods after the waters have receded. And they can detect whether the soil is still very dry a few centimetres below the surface even if rain dampens the soil after a long drought.

Trends in terrestrial water storage can tell us how climate change, land use, and blue water use (including groundwater abstraction) are affecting overall water supplies. Total terrestrial water storage is therefore a good, integrated, blue and green water metric to identify the trend in freshwater availability, and a good proxy for the state of freshwater resources.

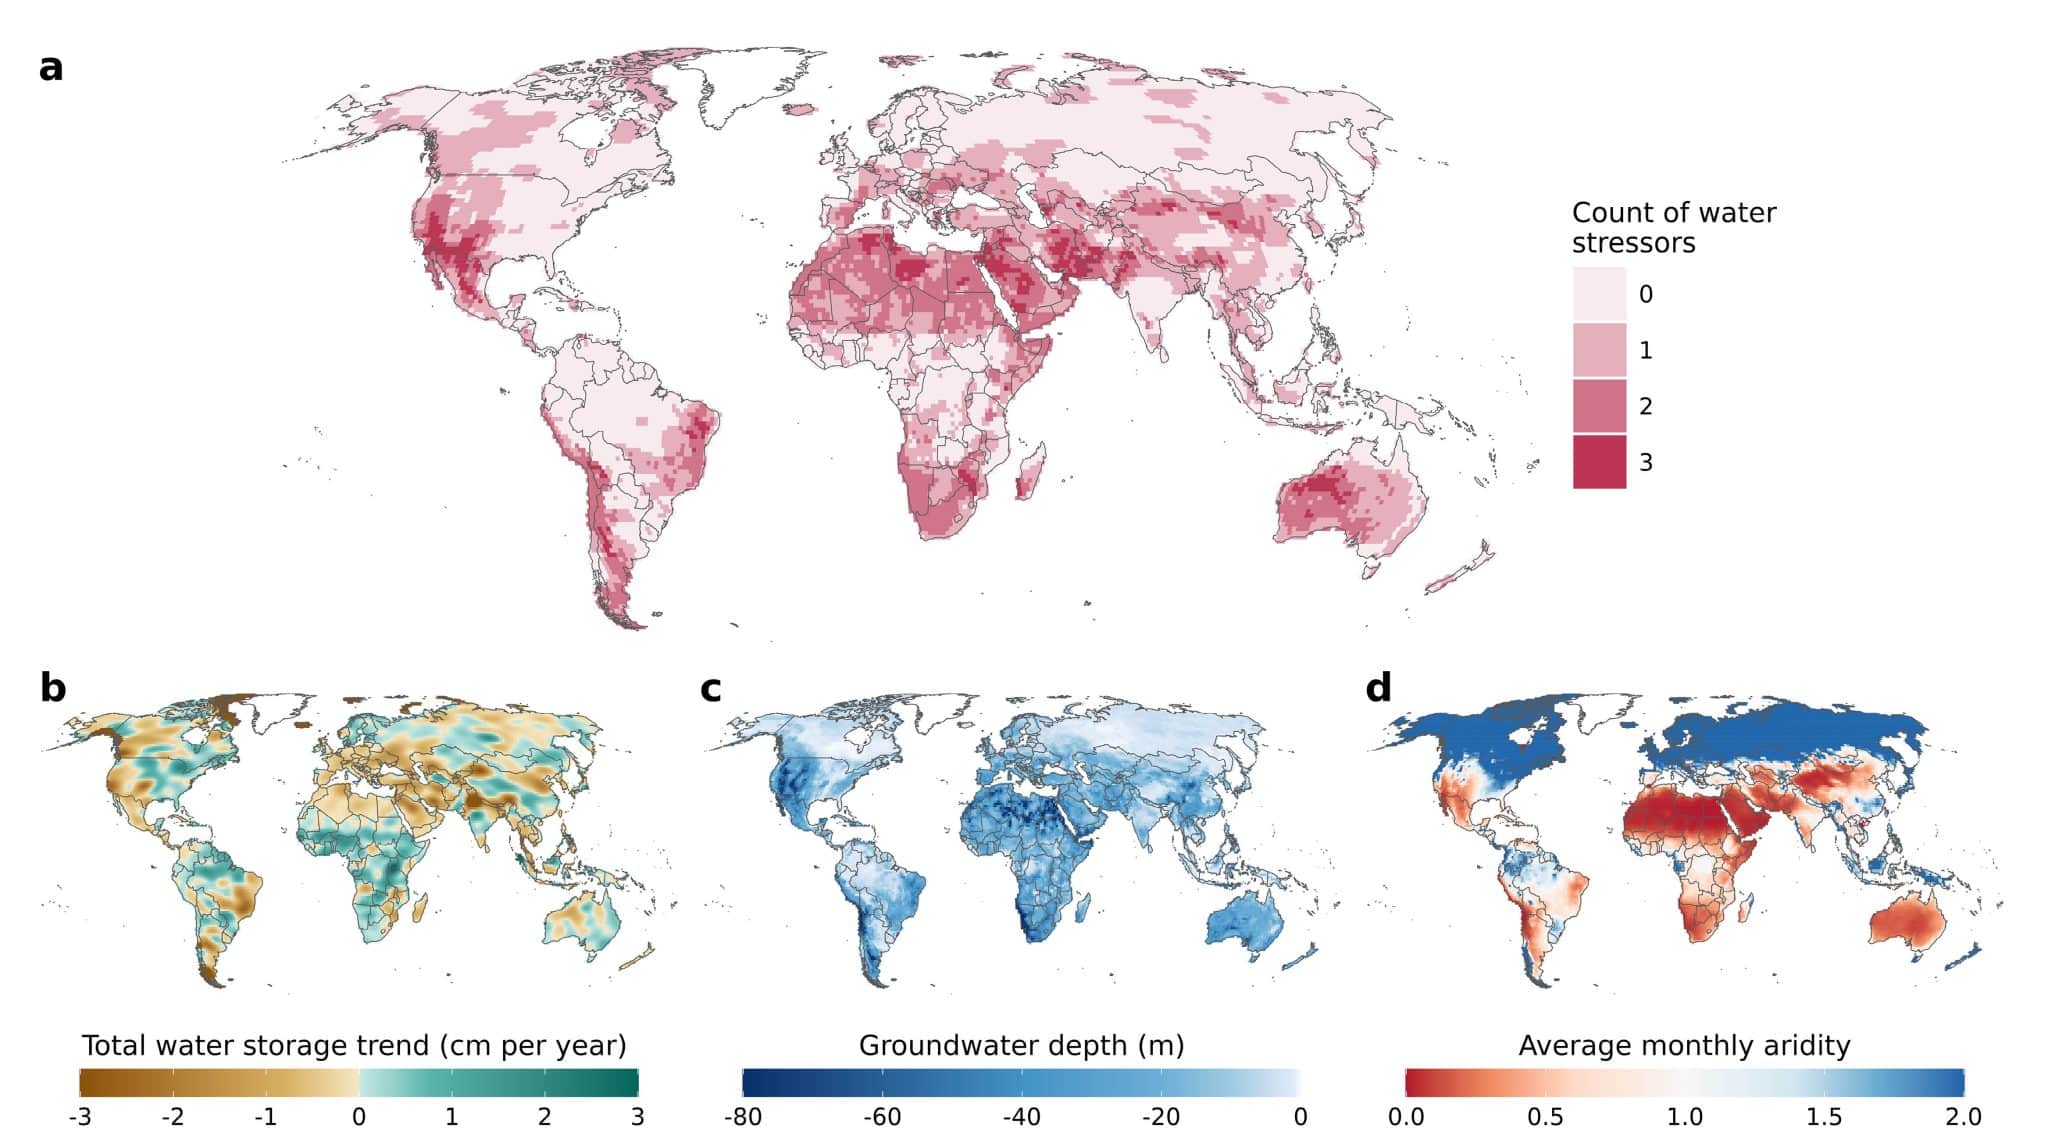
Combined with information about water shortage and physical scarcity indicators, this can help us identify hotspots of particular concern. The biggest terrestrial water storage losses documented to date involve the shrinking Greenland ice sheet and glaciers in the Americas and Asia (Güntner, n.d.). Some areas, such as parts of Central Africa and Southeast Asia, are gaining terrestrial water storage. Figure 2.8 combines terrestrial water storage, groundwater depth, and average monthly aridity to gauge the extent to which areas are exposed to multiple stressors.

Figure 2.8: Uncovering water shortage “hotspots”

Notes: (a) shows how many water stressors a region is exposed to. Colours indicate if a grid cell falls into zero, one, two or three of the following water stress categories: (1) lowest quartile of global total water storage trends distribution; (2) lowest quartile of the global groundwater depth distribution; and (3) lowest quartile of the global aridity distribution. (b)-(d) show spatial patterns of the three water-availability metrics: (b) linear trends in total water storage during the GRACE satellite record 2003-22 in cm of equivalent water height per year; (c) groundwater depth from Fan, Li and Miguez-Macho (2013); (d) average monthly aridity between 2003 and 2019 calculated as precipitation divided by potential evapotranspiration. Classification: Hyper-arid <0.05, Arid 0.05-0.20, Semi-arid 0.20-0.50, Dry sub-humid 0.50-0.65, Humid >0.65. All maps are shown at the ~1° equal-area GRACE grid.

Blue and green water, and the stability of the hydrological cycle, are being affected by human action changing precipitation patterns through climate and land use change. As the mean global temperature rises, the hydrological cycle intensifies, and mean global precipitation increases. On average, every 1°C of global warming adds 7% moisture-holding capacity to the atmosphere, which adds power to the global hydrological cycle, leading to more extreme events, like intense rainfall, hurricanes and cyclonic storms, and associated storm surges and coastal flooding, affecting billions of people. We have today reached a global mean air surface temperature increase of 1.2°C since pre-industrial levels (Caretta et al., 2022).

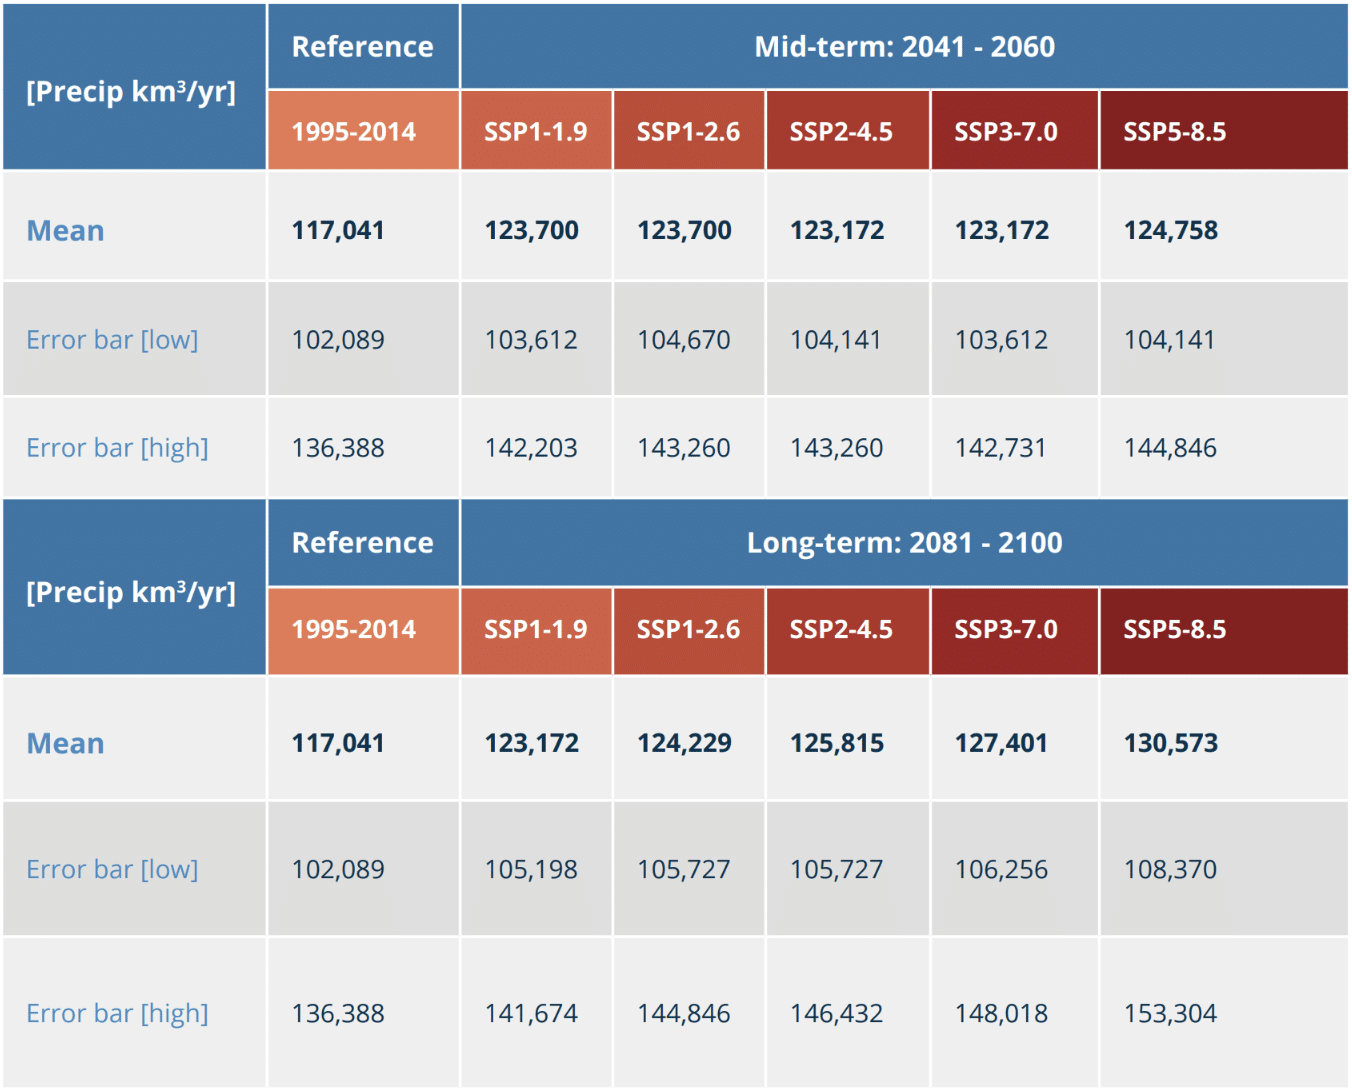
The latest IPCC assessment provides projections of expected changes in global precipitation under different warming scenarios (RCPs) and world development trajectories (Shared Socioeconomic Pathways, (SSP) (Douville et al., 2021).  Here, we translate these projections of daily change (mm/day) to annual estimates (km3/yr) over land areas only (Table 2.2). We find that terrestrial precipitation in the reference period 1995-2014 is almost at 120,000 km3/yr, a marked increase from previous estimates of 110,000 km3/yr in earlier decades (e.g. Speidel and Allen, 1982). With continued climate change, terrestrial precipitation could increase over 10% globally from 1995-2014 levels by the end of the century, depending on the SSP climate scenario.

Table 2.2: Projected change in global terrestrial precipitation, by SSP scenario

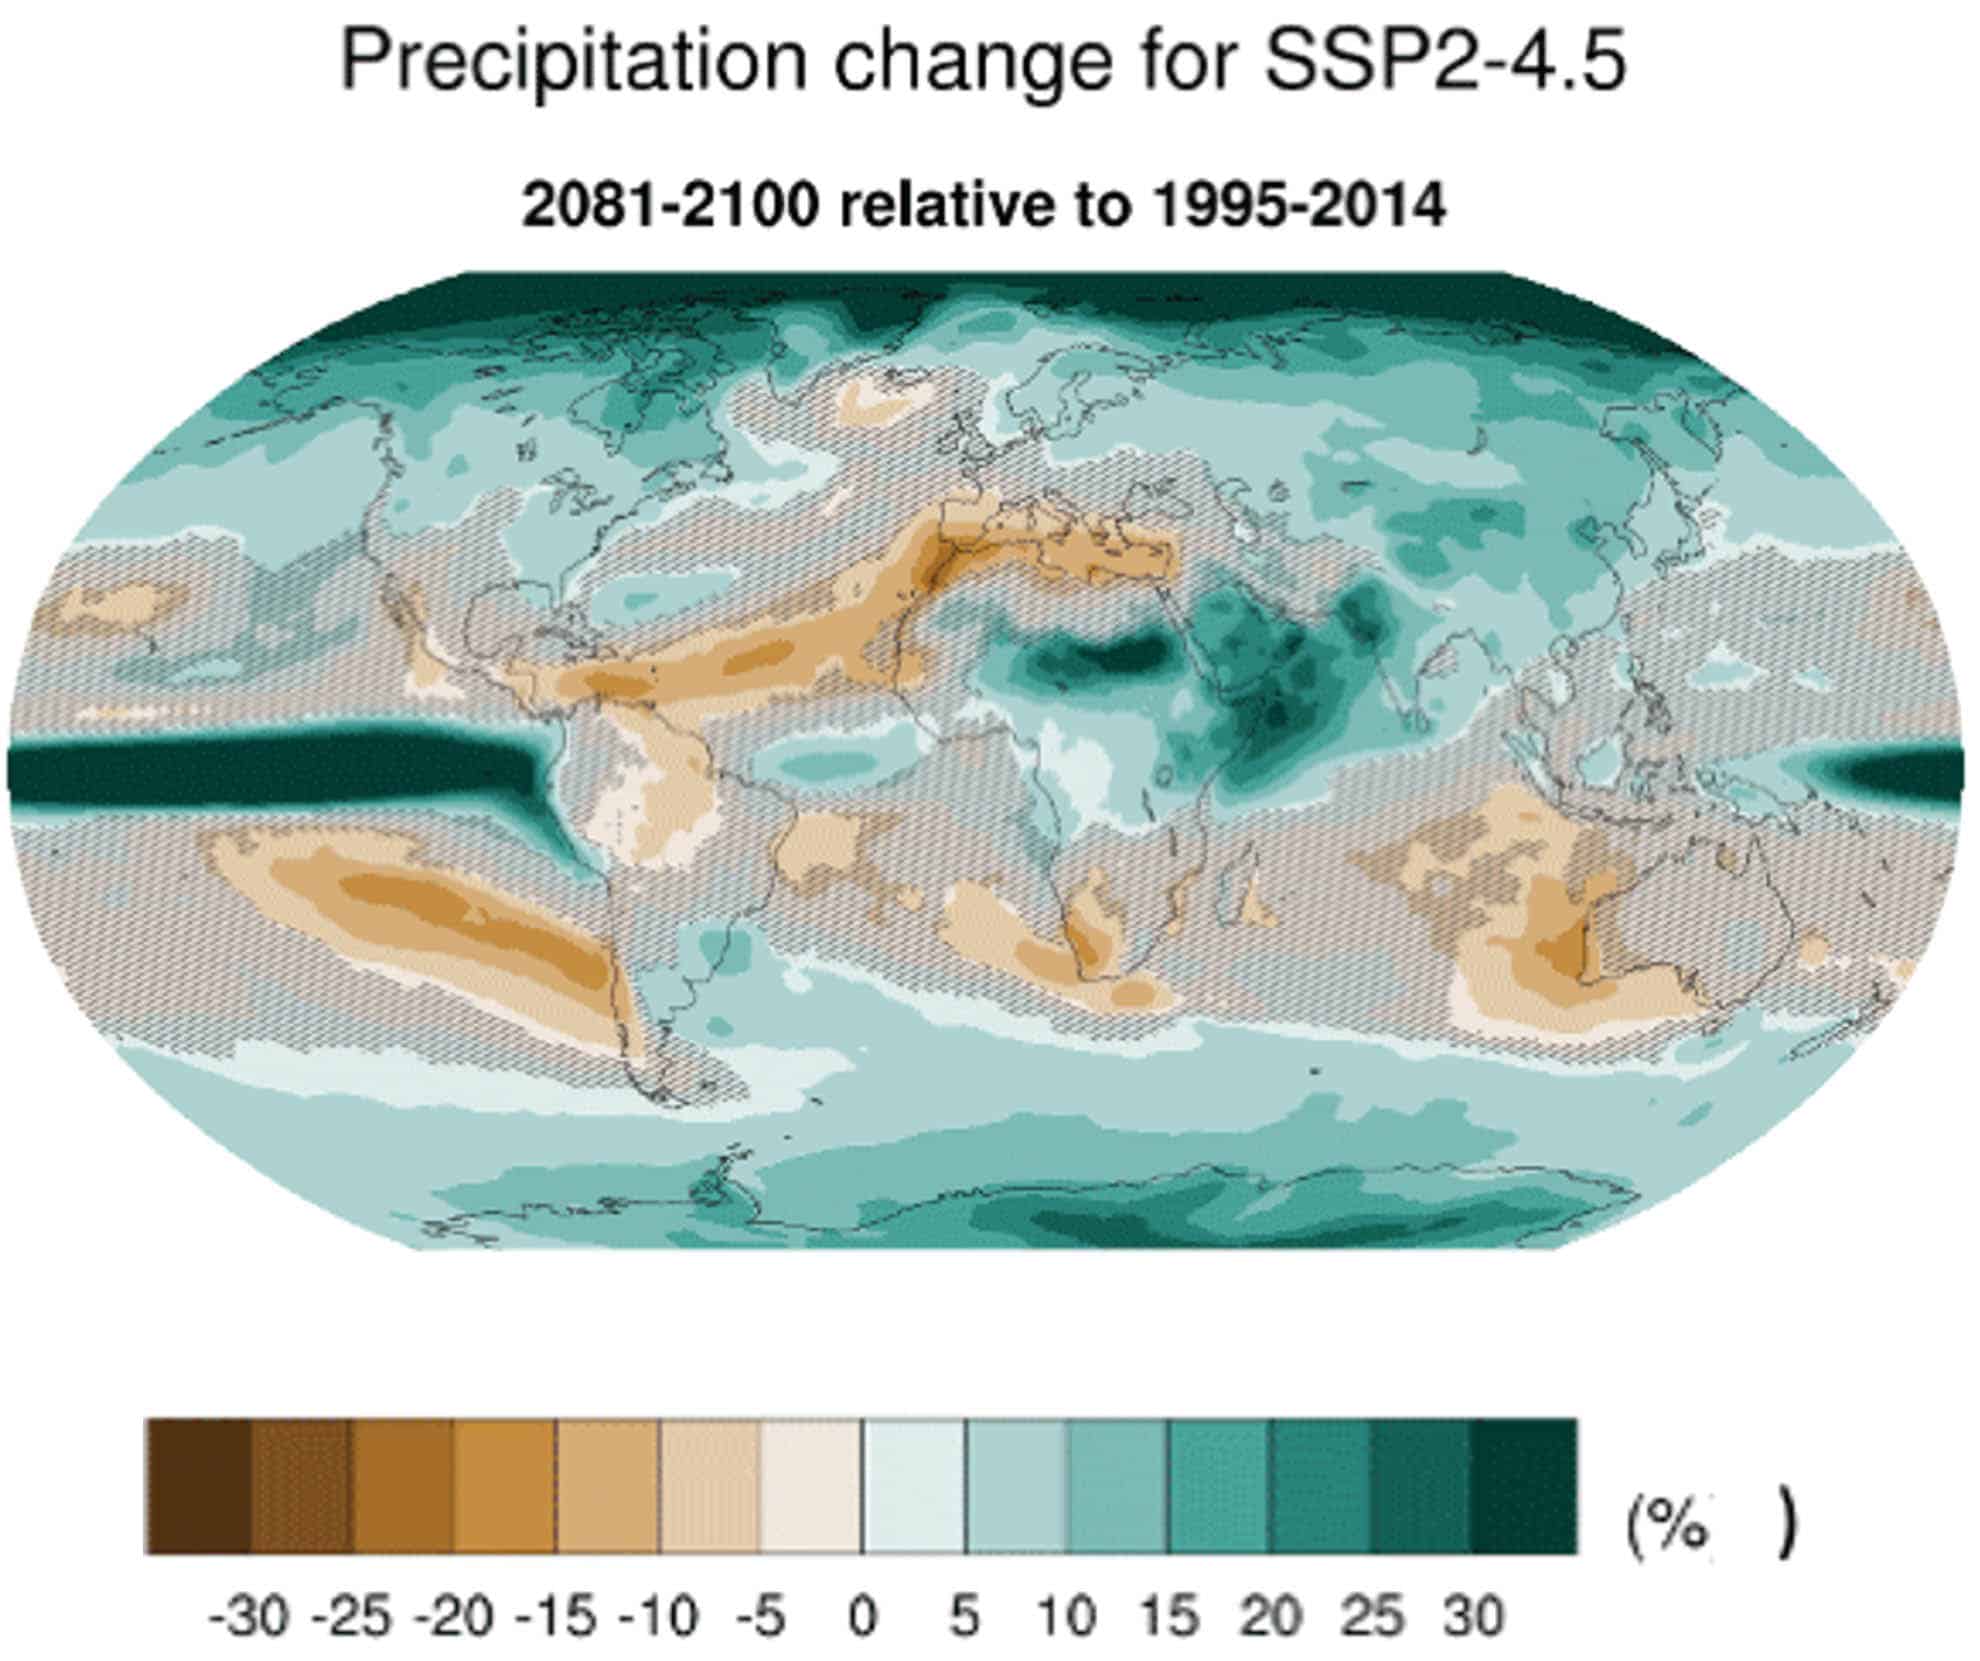
As the increase in catastrophic hurricanes and torrential rainfall has already shown, a warmer, wetter world comes with increasingly severe water-related disaster risks (Caretta et al., 2022). At the same time, even though precipitation is projected to increase at the global scale, there are large differences between countries and regions. Figure 2.9 shows the percentage change in precipitation under the moderate (SSP) 2-4.5 climate scenario in the long term (2081–2100): Central Africa, India, and China see up to 30% more rainfall, but most of Europe, Central and South America, South Africa, and Australia see decreases of as much as 25%. Land-use change could exacerbate the drying effect by reducing terrestrial moisture recycling.

Figure 2.9: Projected percentage change in mean annual precipitation (SSP2-4.5 2081–2100 relative to 1995–2014)


Notes: Projected percentage change in mean annual precipitation (2081–2100 relative to 1995–2014), ensemble mean over the CMIP6 climate models based on simulations for SSP2-4.5 Source: Tebaldi et al. 2021 M

Transboundary green water

Like many river basins and aquifers, atmospheric moisture flows are transboundary resources, carrying water from one country to another, even across continents and oceans. Global atmospheric moisture flows have been mapped and quantified to show how the freshwater cycle connects countries and regions around the planet (Dirmeyer et al., 2009; Tuinenburg et al., 2020).

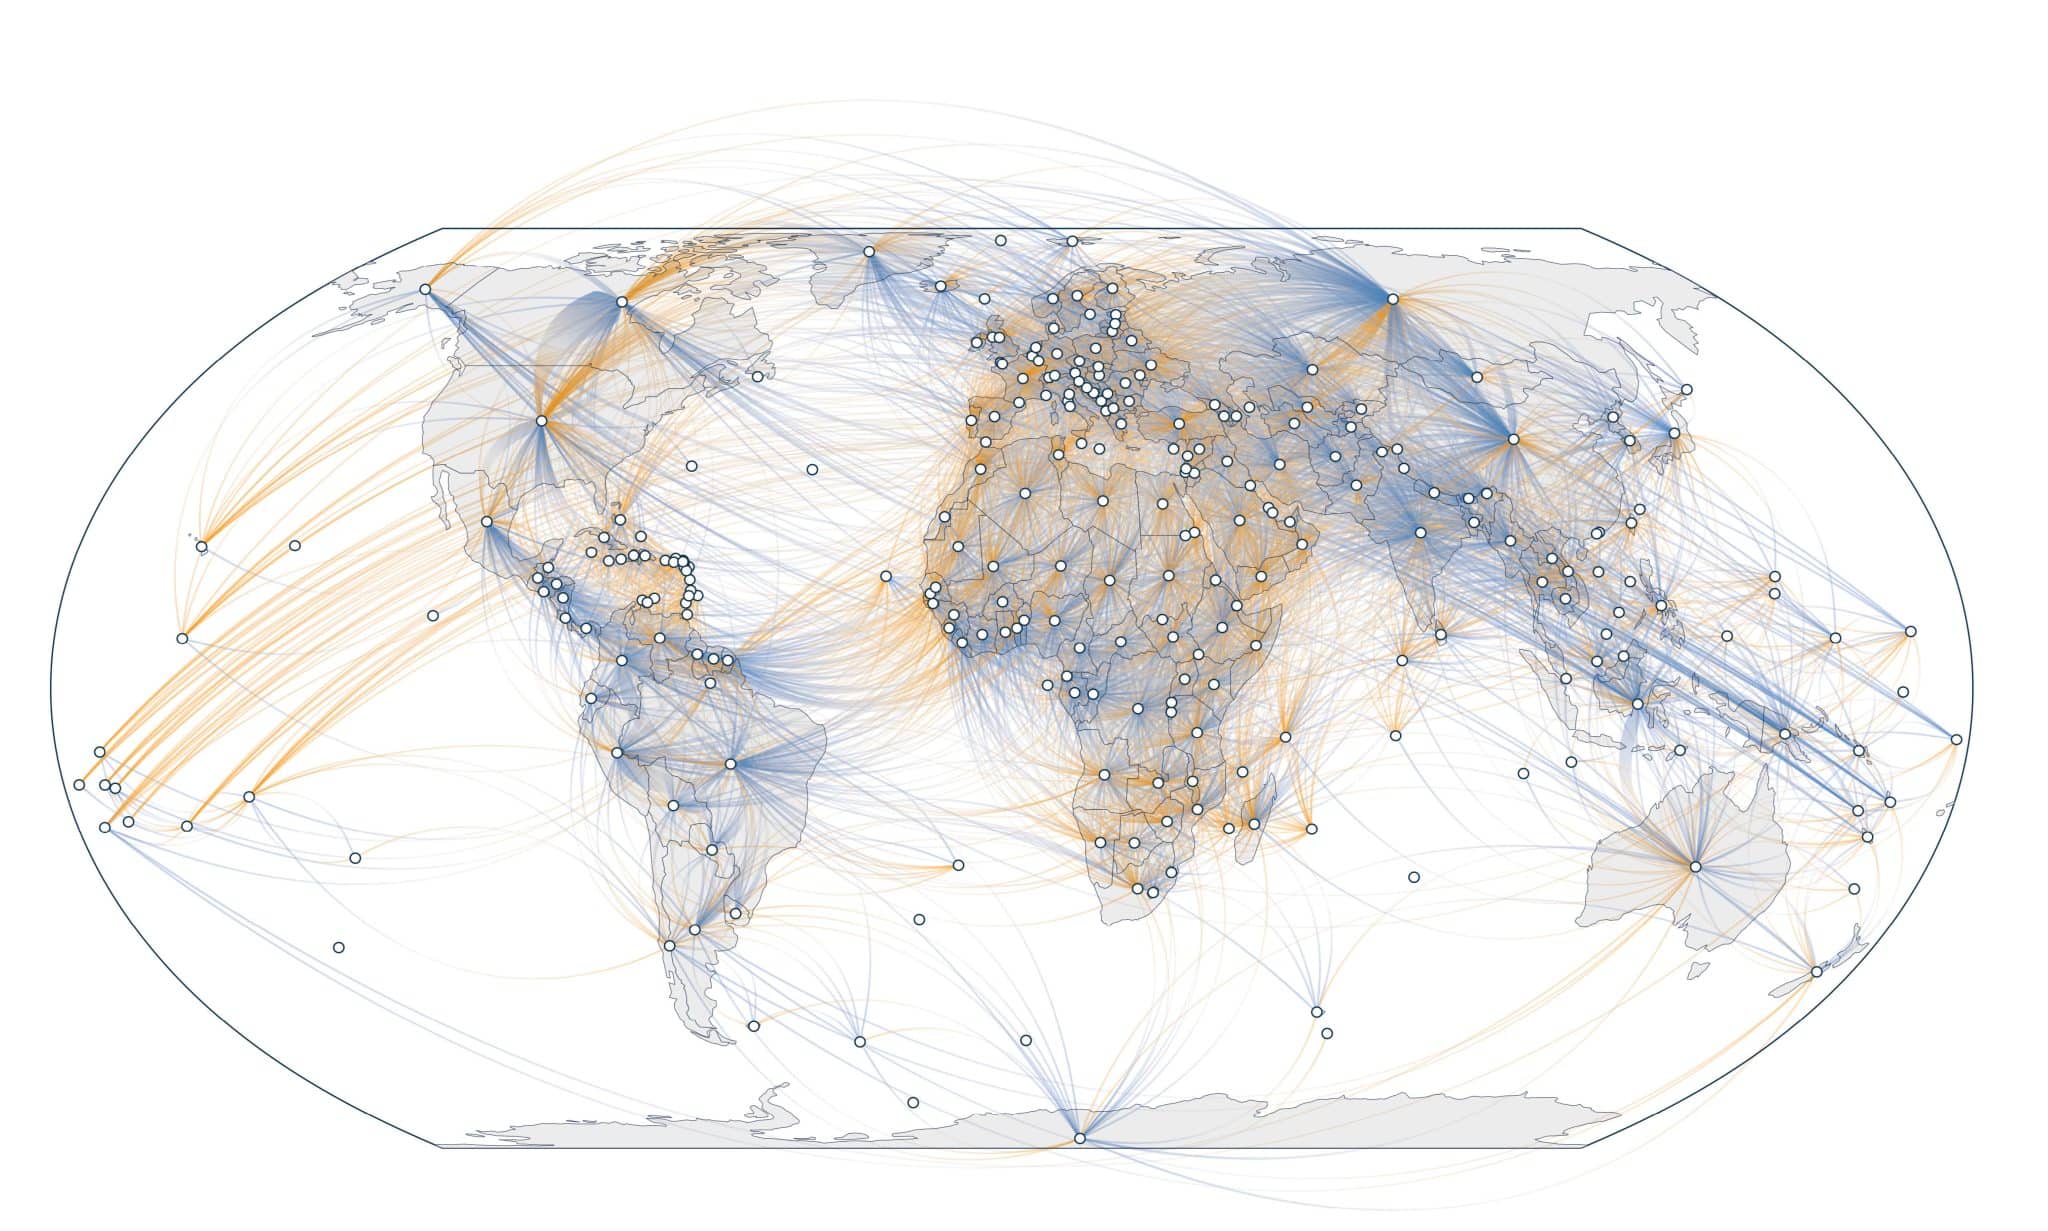
Figure 2.10 shows terrestrial moisture exchange between countries according to a reconciled country to country flow network (De Petrillo et al., 2024), depicting the striking interconnectedness of countries through atmospheric moisture flows. Land to land moisture connections can be seen across oceans, connecting evaporation in west African countries to rainfall in South American countries, and evaporation in North American countries to precipitation in European countries.

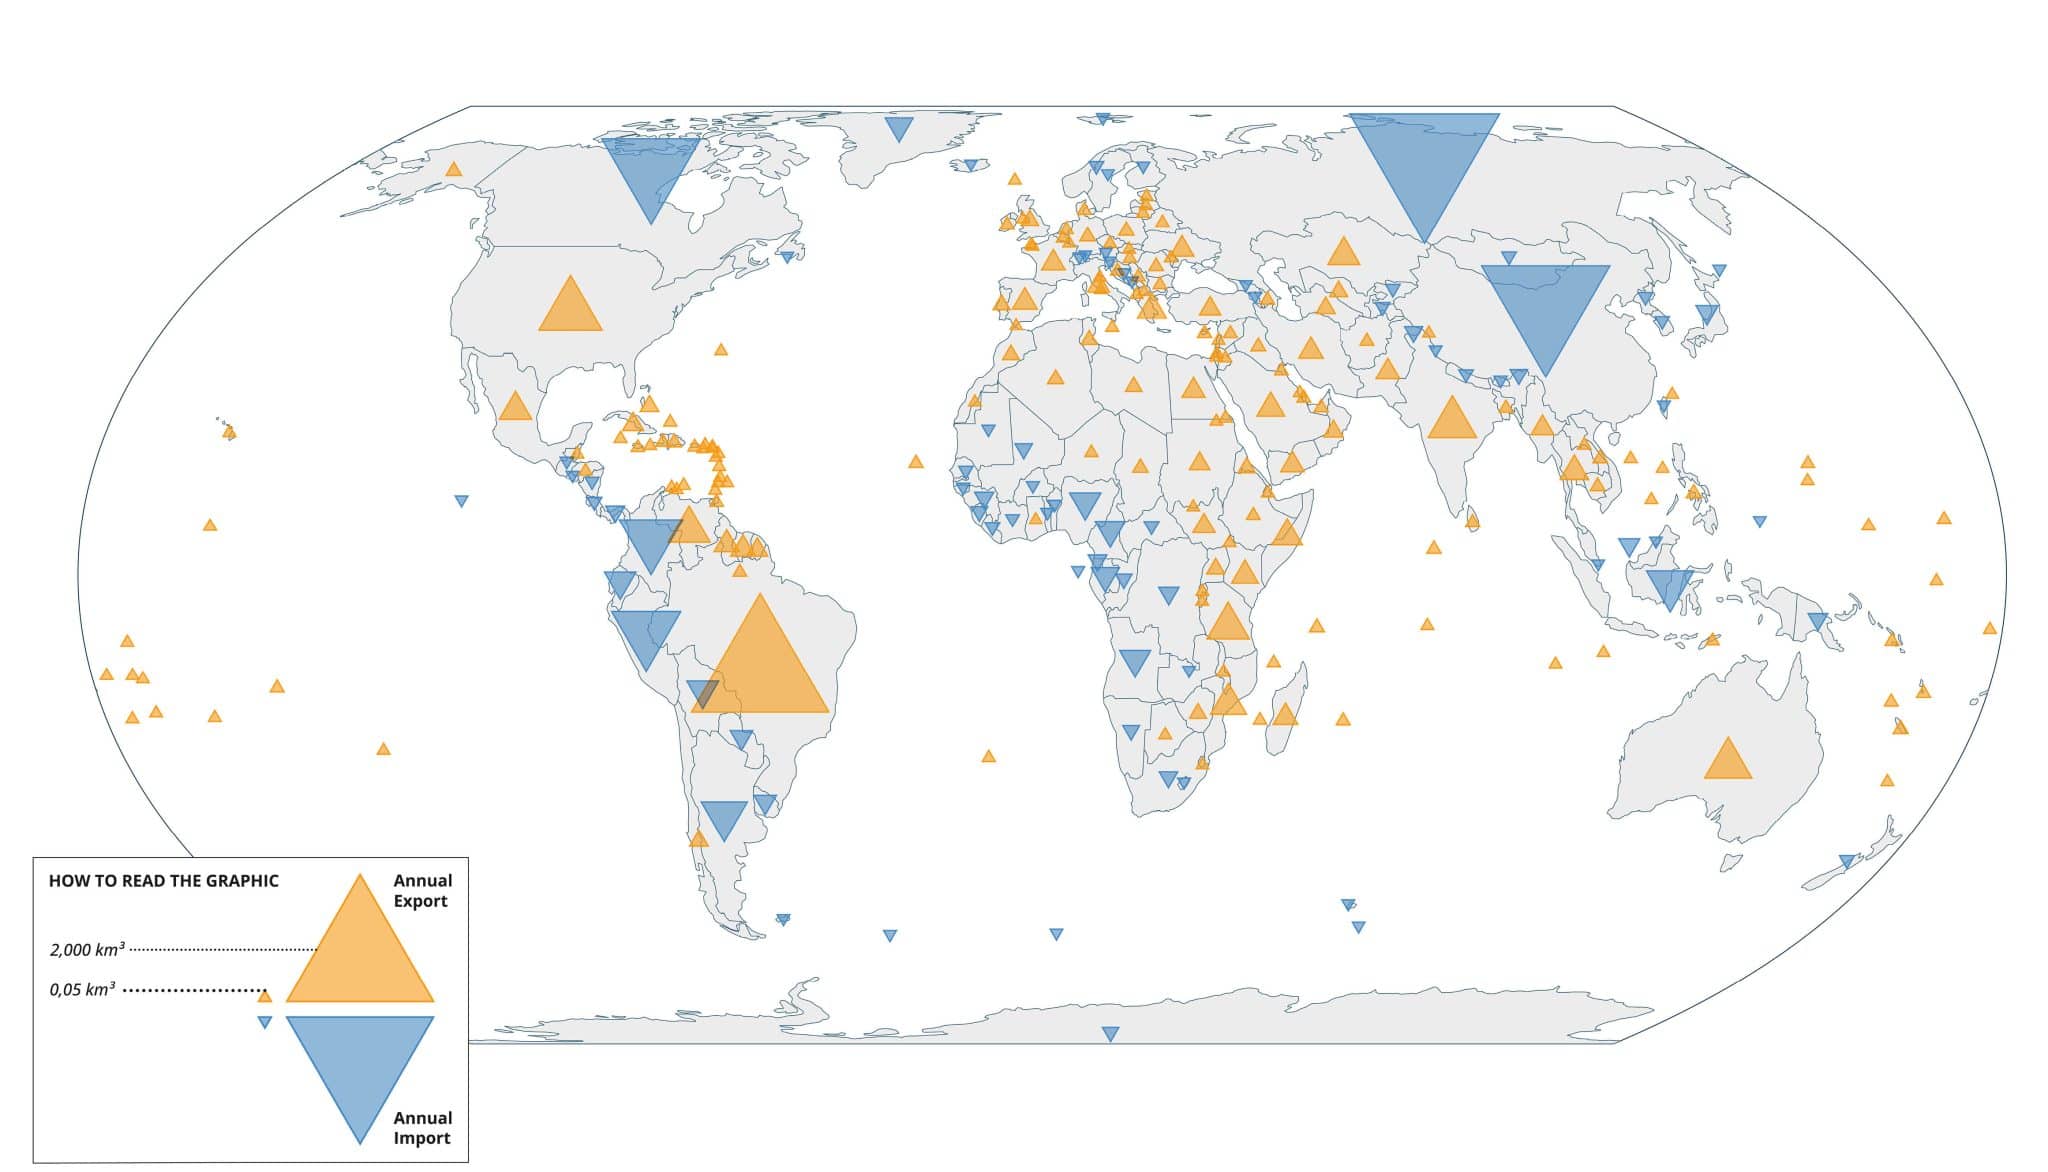
The subcontinental moisture flow dynamics are well illustrated with the case of Brazil, which receives moisture from across the Atlantic Ocean, recycles this rainfall through the Amazon rainforest, which evapotranspires and sends moisture downwind to its neighbouring countries. This makes Brazil a so-called net exporter of terrestrial moisture, as it sends more green water flow (ET) to other countries than it receives (Figure 2.11). Overall, South America is a net importer of moisture, primarily from the South Atlantic Ocean, but the continent also has the largest volume of moisture recycling, owing to the moisture-generation and conveyance power of the Amazon rainforest, which creates 36% of its own rainfall (Smith et al., 2023).

Figure 2.11 shows the degree to which countries are net importers or exporters of land to land moisture flow. Some countries with large, dense tropical forests, such as Brazil and the Democratic Republic of Congo, and/or vast land areas, such as China and Russia, have high rates of domestic moisture recycling (De Petrillo et al., 2024) and thus significant self-interest in protecting those ecosystems. A key takeaway from Figure 2.10, however, is that green water supplies are far more regionally interdependent than realised.

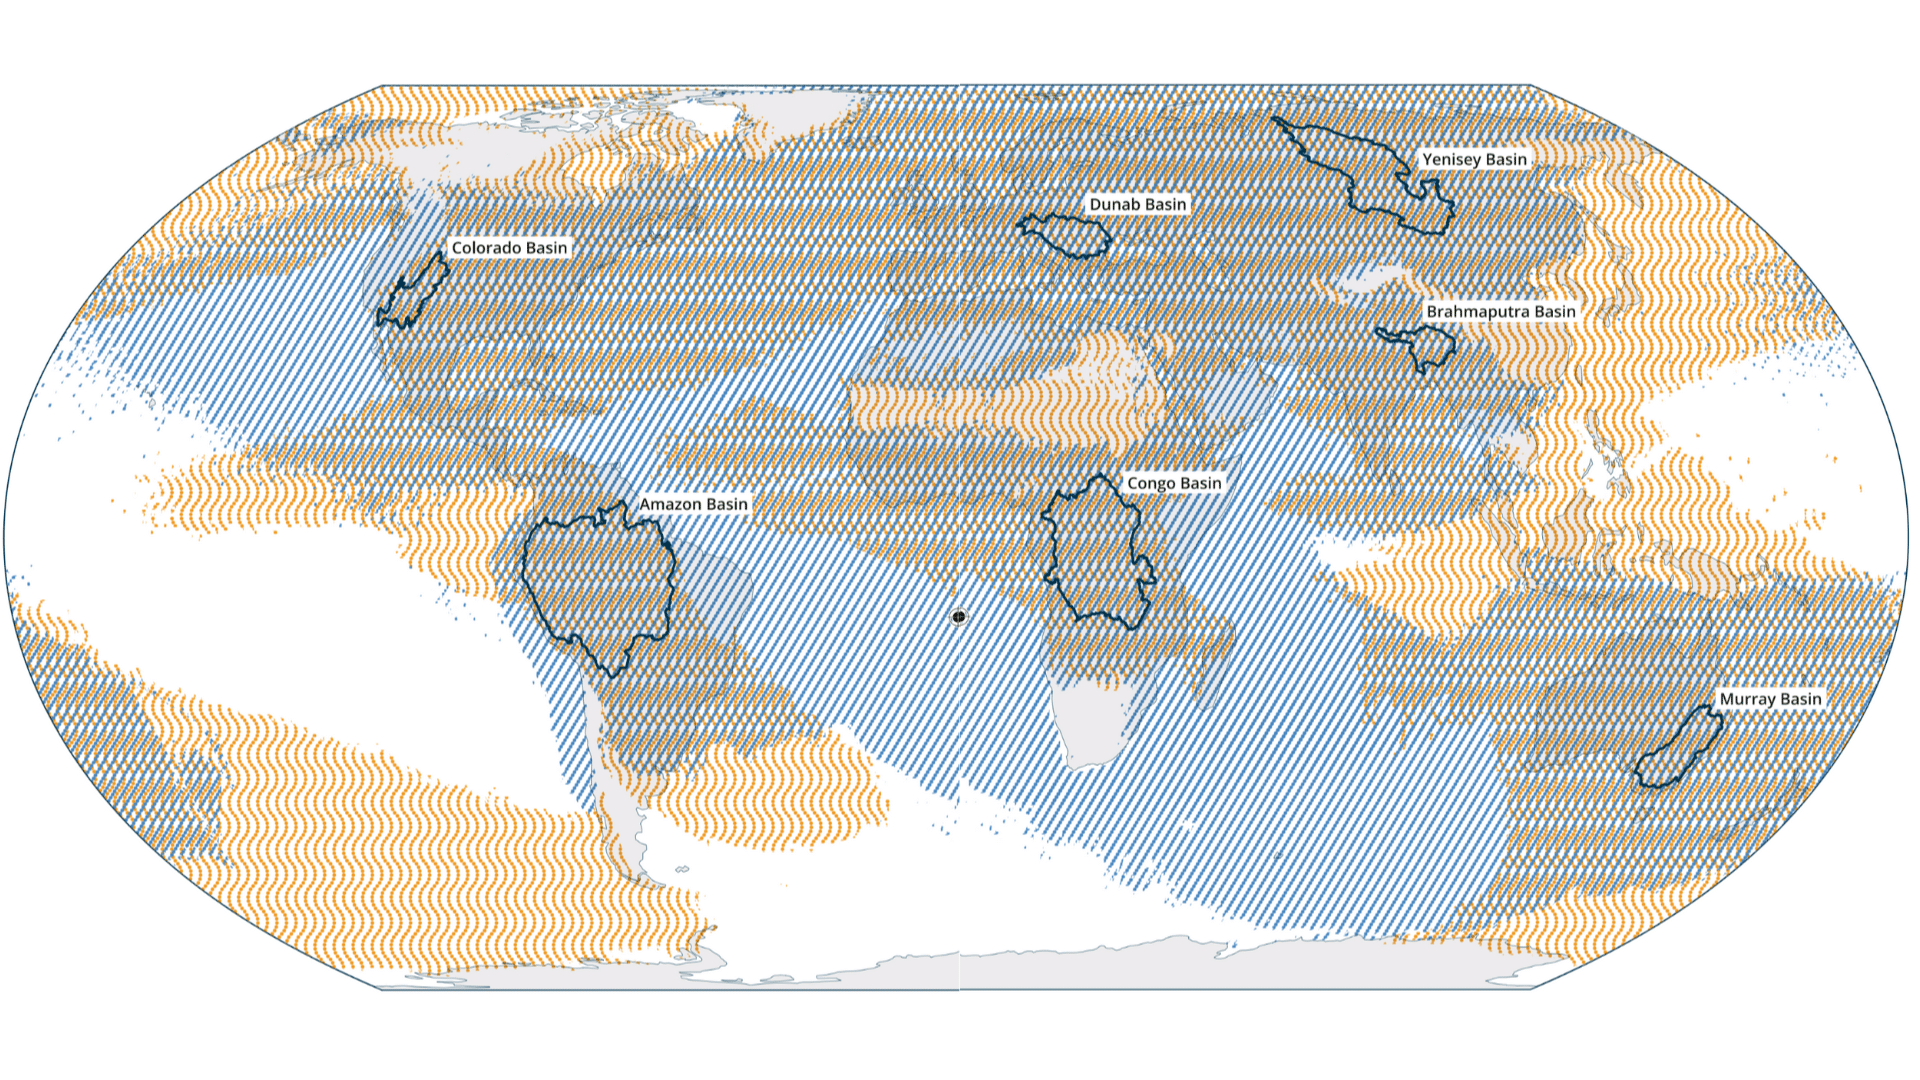
Figure 2.12 shows the atmospheric moisture sink and source regions of four major river basins around the world (Amazon, Congo, Danube, Murray). Notably, the precipitationsheds and evaporationsheds of these major river basins extend to regions well beyond the surface area of the basin itself, even reaching across oceans to other continents. Not only does this broaden the concept of transboundary water, but it makes a compelling case for a globally connected freshwater cycle.

This evidence shows that all countries and regions are interconnected and depend on one or several neighbouring areas to secure stable freshwater supplies. Furthermore, intact and biodiverse ecosystems and managed lands which do not adversely impact their hydrological functioning (i.e., green water flux) are critical to preserving terrestrial moisture recycling and securing 50% of precipitation on land. Atmospheric moisture flows connect all continents, making freshwater a global common good that needs to be governed as such.

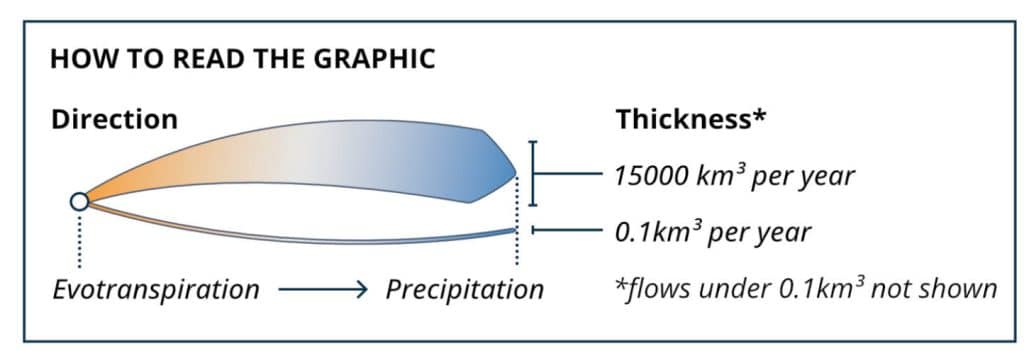
Figure 2.10: Global terrestrial moisture connections between countries

Notes: Average annual terrestrial moisture exchange between countries is depicted with flow arrows which begin as evaporation (shown in orange) in the source country and end as precipitation (shown in blue) in the sink country. . Each country is represented in the flow network by a white dot at its centroid. Based on average annual flows over the periods 2007-2018. Source: GCEW based on data from De Petrillo et al., 2024.

Figure 2.11: Countries as net importers or exporters of atmospheric moisture

Note: Countries are depicted as net importers or exporters of terrestrial moisture, based on average annual flows over the periods 2007-2018. Source: GCEW based on data from De Petrillo et al., 2024.

Figure 2.12: Precipitationsheds and evaporationsheds of major basins on every continent


Note: Amazon (South America), Congo (Africa), Danube (Europe), Murray-Darling (Australia). Source: GCEW based on data from De Petrillo et al., 2024.

The hydrological cycle as a global common good

It is time to rethink the economics of water to help steer the world away from dangerous over-consumption, profound injustices and dwindling, degraded water, and towards a just and sustainable future where competing priorities of efficiency, equity, and environmental sustainability are managed. The latest scientific assessments point to the need to reframe the hydrological cycle as a global common good.

First, the hydrological cycle links countries and communities. This is well established for blue surface water in rivers and lakes, and the local institutions, property rights and valuation and pricing mechanisms that have evolved over millennia. This is less well understood in the case of groundwater, which is also largely managed as a local issue. Groundwater is more difficult to visualise and monitor, although new satellite technology is making it easier. Even less understood, and thereby absent in economics and policy, is the country and sector inter-connectedness through green water. Recent studies have given us a much better understanding of the green water size and dynamics in the hydrological cycle and especially the share of terrestrial water recycling, which is no longer a local or even a regional issue but part of the overall functioning of the biosphere. And what ultimately regulates the annual cycling of freshwater and the stability of future water supply, i.e., rainfall.

The argument that water action in one part of the world does not benefit or affect countries or communities in other parts of the world is no longer true in the 21st Century due to human caused global environmental change, and advances in scientific understanding. The latest science suggests that, while the local and transboundary dimensions of blue water remain, the regional and global dimensions of green water require further collaborative investigation across all countries and regions.

These local, regional, and global interdependencies will need to be acknowledged, better understood, and managed for the greater common good of current and future generations and the biosphere, based on that:

  • Water travels long distances. Atmospheric moisture flows connect communities across borders, continents, and oceans in patterns that shift with the prevailing winds and rarely match the already-complex geography of surface water and aquifers.
  • The science of terrestrial moisture recycling helps understand how local actions – typically land-use change – can affect rainfall in other parts of a country or distant regions.

Second, the global hydrological cycle is deeply interlinked with the climate and biodiversity crises. The hydrological cycle is clearly impacted by climate change. Evidence shows that the destabilisation of the hydrological cycle can exacerbate the climate crisis. For example, when green water is lost through deforestation and unsustainable land-use practices, carbon storage is reduced in the soil and vegetation (Nabuurs et al., 2023). Hence, there is a case that the stabilisation of the hydrological cycle should play a much more prominent role in national strategies to mitigate climate change. The Paris Agreement requests to define new Nationally Determined Contributions (NDCs) every five years, and the upcoming cycle provides an opportunity for a radical reassessment of the role of water management in ambitious and effective climate-mitigation policies.

Beyond climate, the water crisis is deeply intertwined with biodiversity loss and desertification – issues that are recognised as systemic and global (IPCC, 2019). Both droughts and floods can exacerbate soil erosion and land degradation, which can create feedback loops: ever-less fertile soil that cannot support vegetation or absorb rainfall, more green water lost, and more land cleared to grow crops. Droughts and wildfires cause massive losses of biomass, carbon storage, and biodiversity. The loss of mangroves, peatlands, and other wetlands is depleting some of the Earth’s greatest carbon stores. Land tenure exacerbates justice issues, as degraded lands (with low green water levels) tend to be allocated to the poorest.

Integrated water resources management (IWRM) provides an operational framework to enable the required shift. It starts from the premise that water is a shared resource that must be managed in a participatory manner to consider the needs and perspectives of all users and balance ecological, economic and equity considerations. Mainstream integrated water resources management usually applies to only blue water, is geographically constrained (usually to a river basin), and mainly focuses on how to allocate supply to meet multiple demands. Extending integrated water resources management to address green water stocks and flows, and linking that to land use change and the underlying drivers of water demand is the next frontier that needs to be addressed.

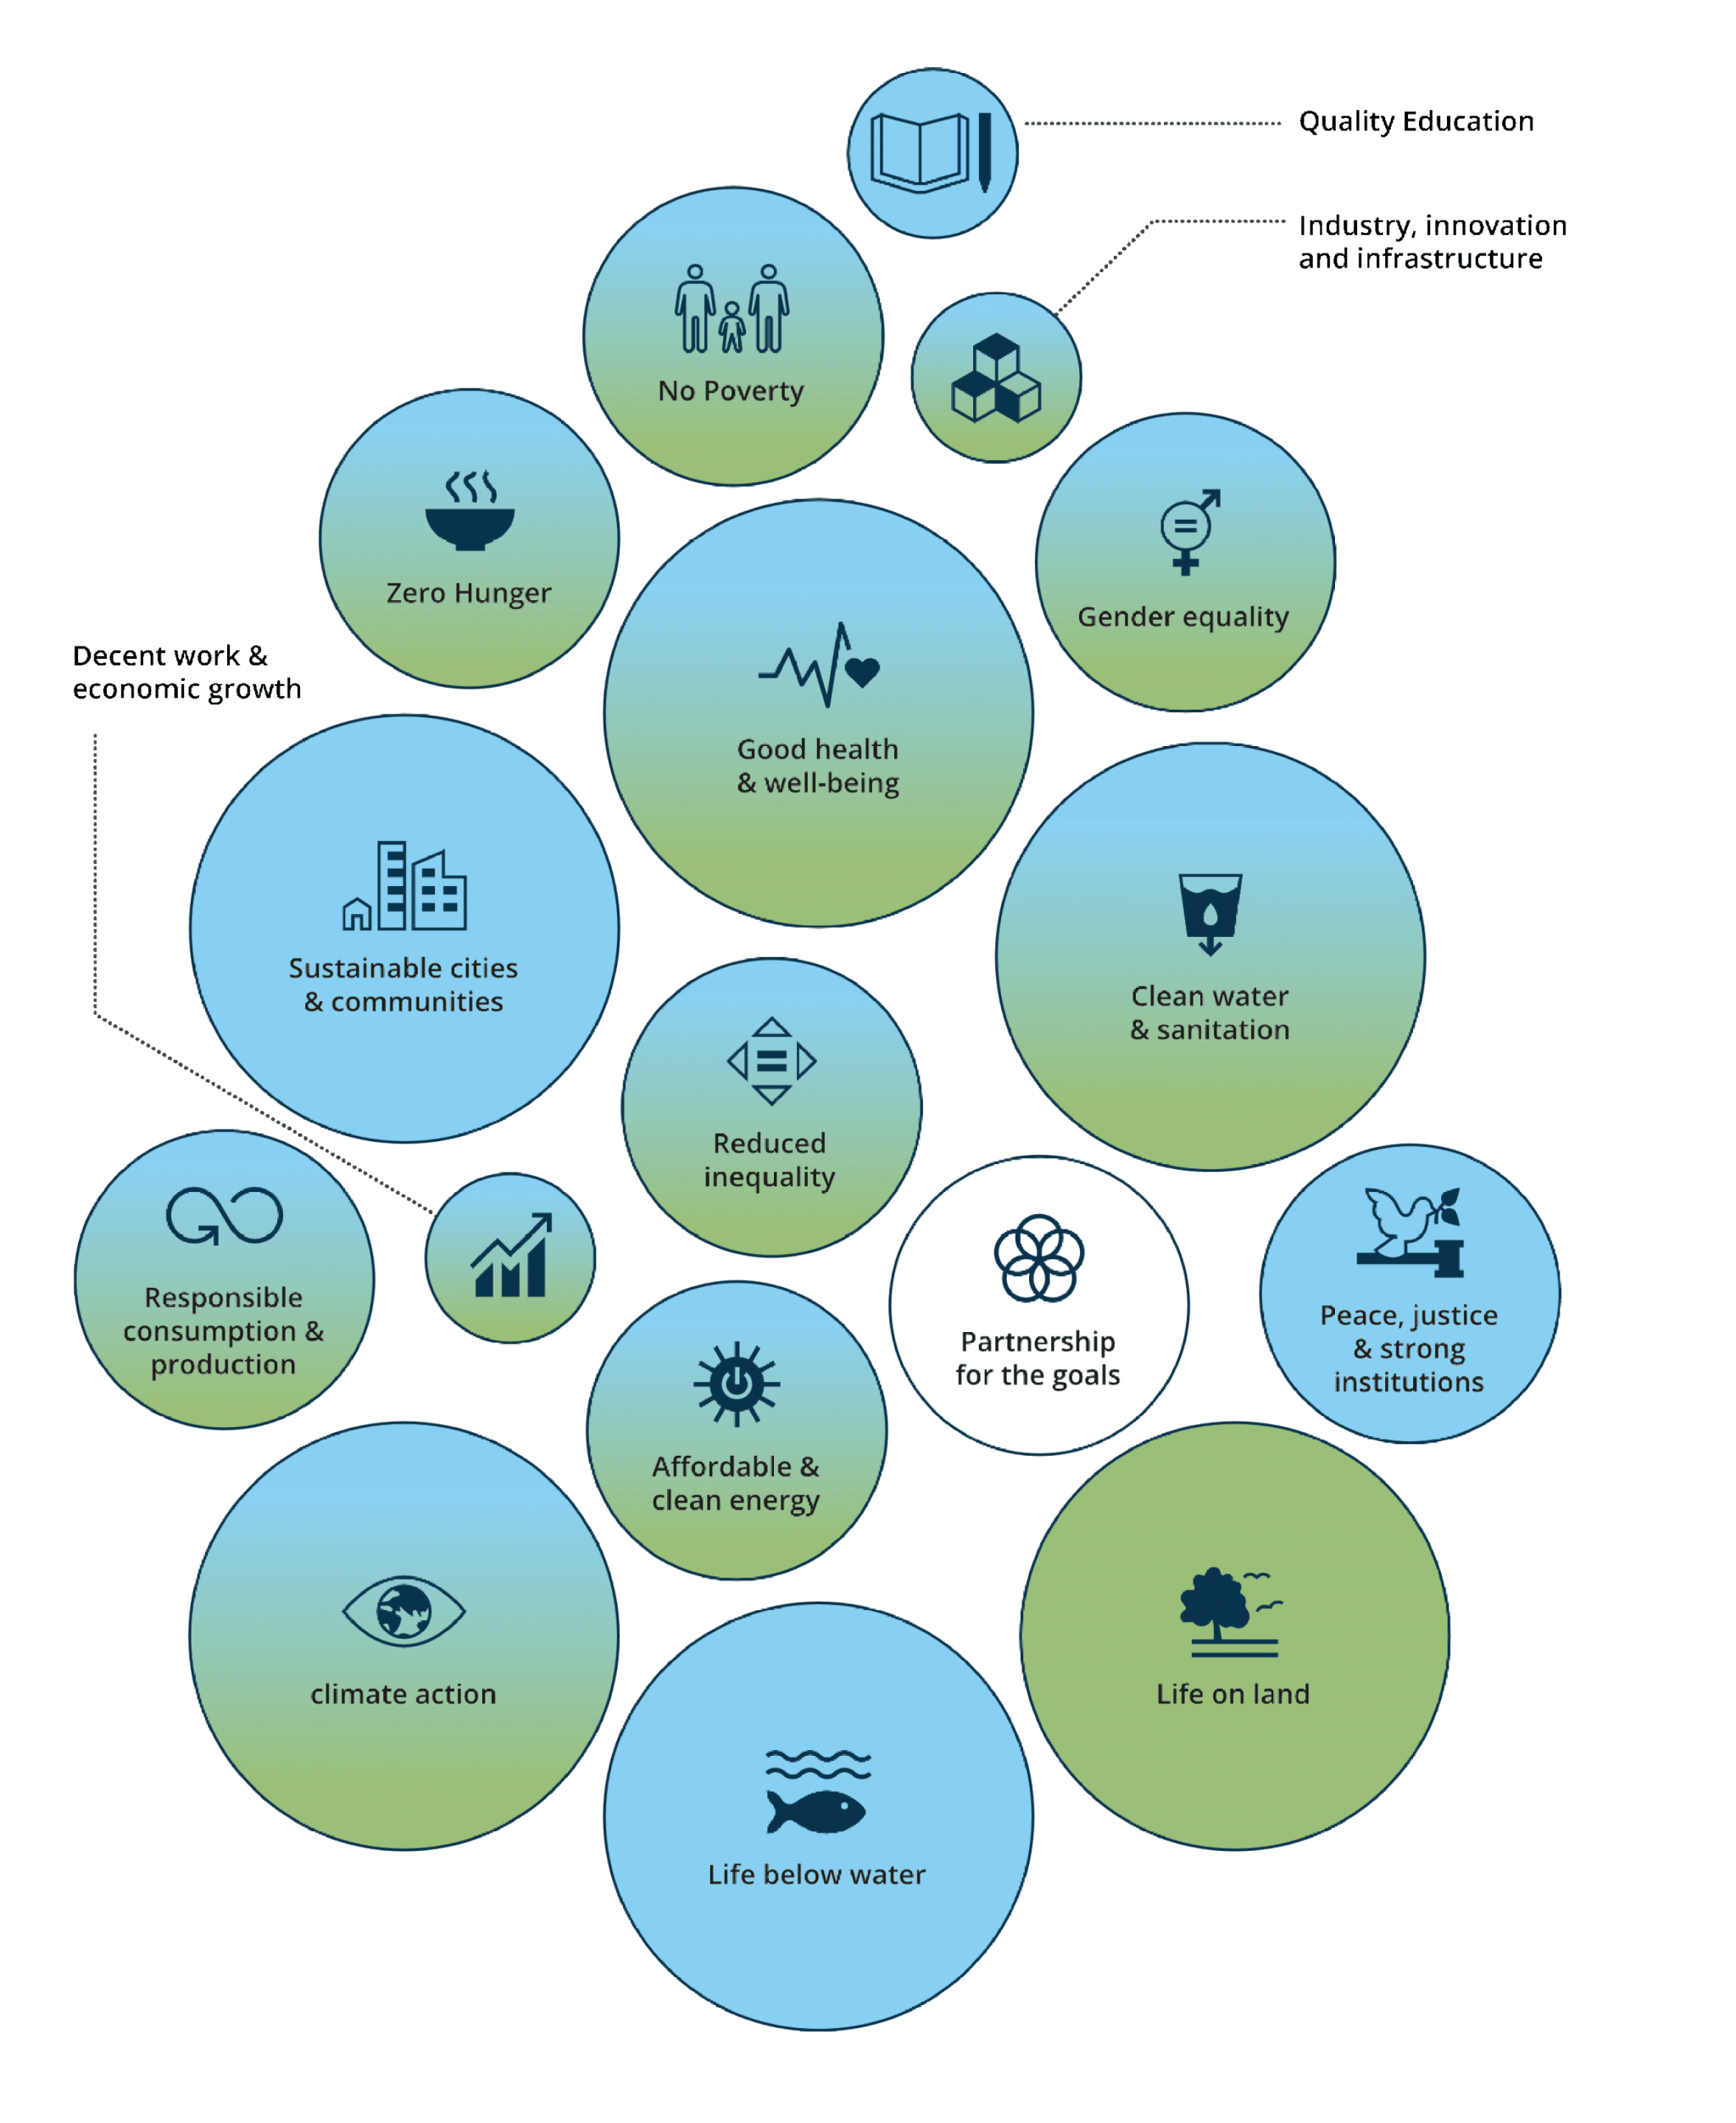
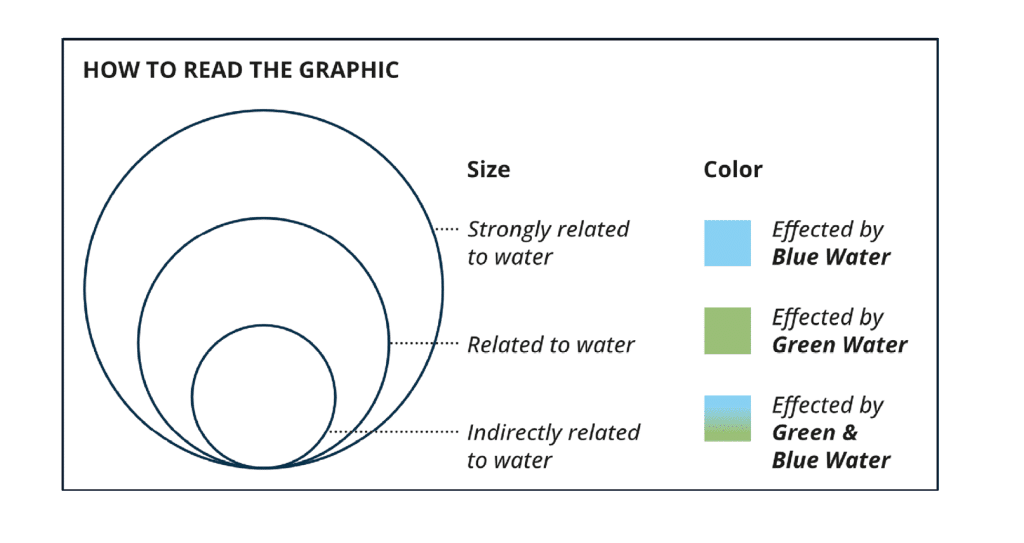
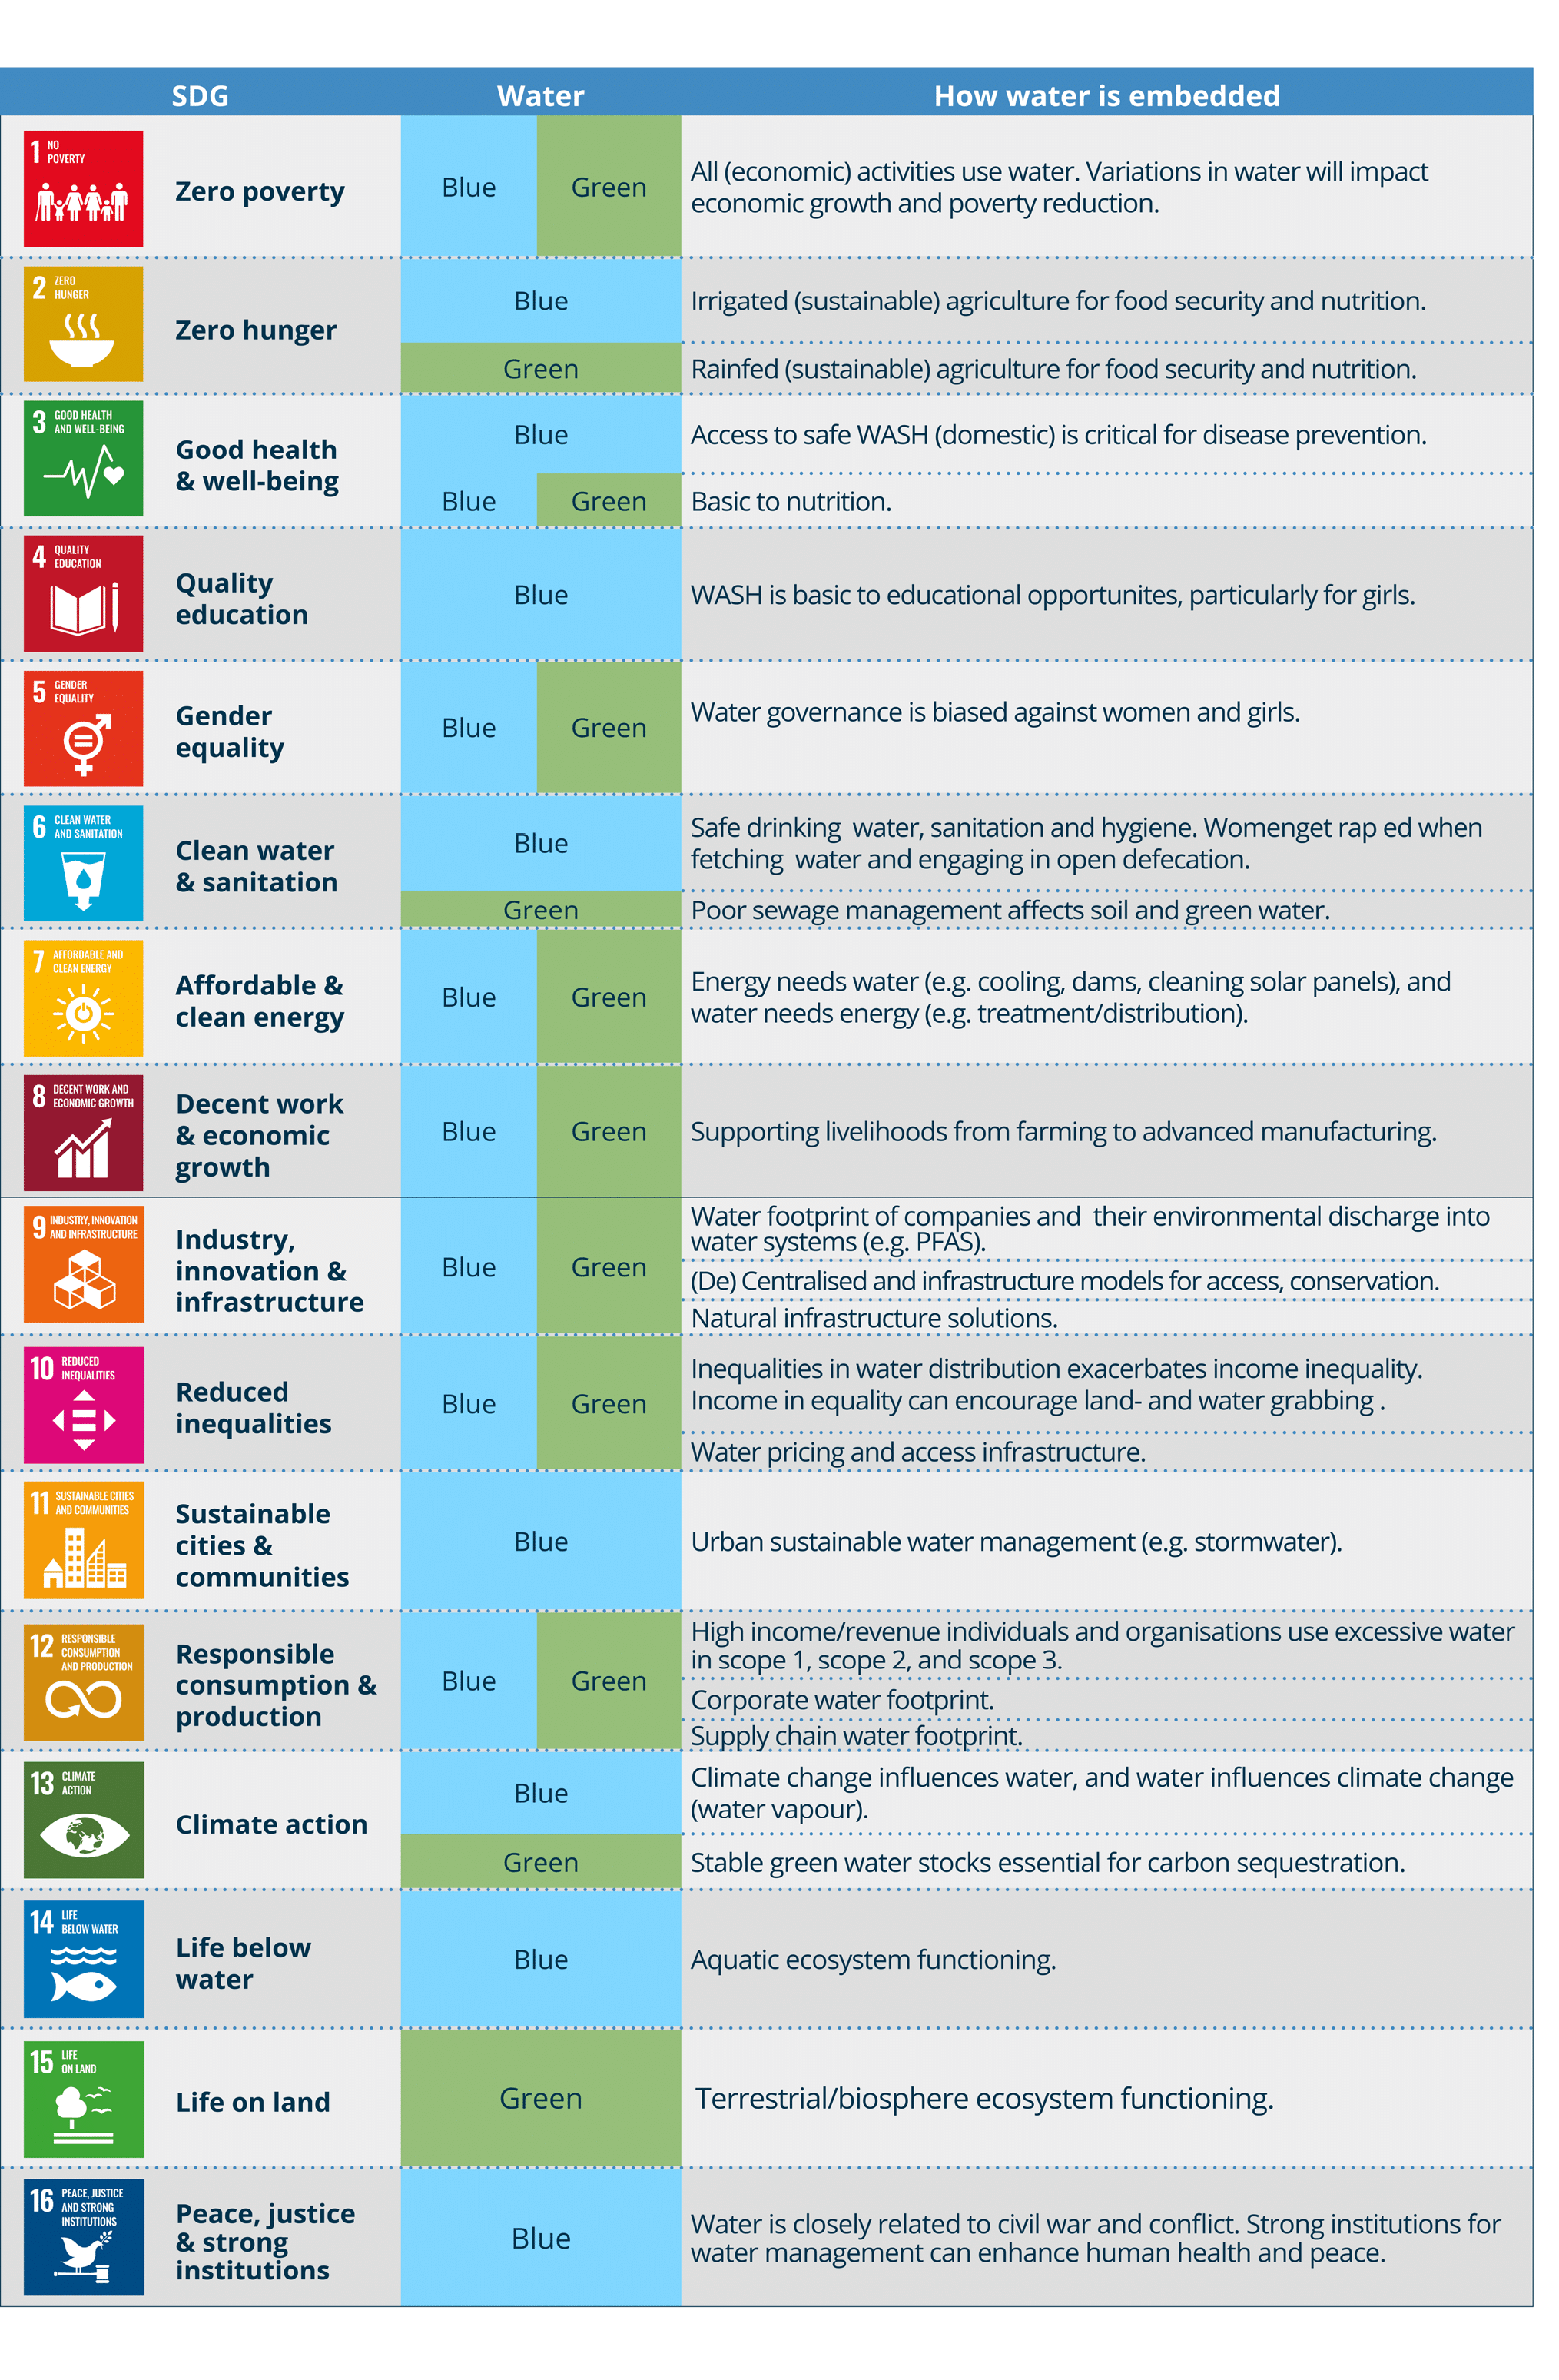
Third, water plays a direct or indirect role in achieving all the SDGs, which are crucial for global prosperity and to end poverty and reduce inequality. While water, sanitation, and hygiene have a dedicated goal in SDG 6 – “Ensure availability and sustainable management of water and sanitation for all” – water is crucial for almost all the SDGs. Significant volumes of freshwater reside behind all ecosystem services that support human well-being and the economy (Rockström et al., 2014; Dasgupta, 2021). Water regulates the climate system, provides the pre-conditions for communities and societies to thrive, and is the ultimate factor for economic development. Figure 2.13 and Table 2.3 depict how green and blue water are embedded in economic sectors, and how those connect to the SDGs. Because water is essential to the SDGs and the entire economy, the actions and choices made in a wide range of sectors affect water resources in profound ways. Water should therefore not be considered a sector, which can be managed in a siloed way or in isolation. The global water crisis must be addressed in a cross-sectoral, economy-wide manner, across all colours and hues of water.

Figure 2.13: Green and blue water embedded in the SDGs

Table 2.3: Blue and green water relevance to each SDG

SDG

Water

How water is embedded

Zero poverty

Blue

Green

All (economic) activities use water. Variations in water will impact economic growth and poverty reduction.

Zero hunger

Blue

Irrigated (sustainable) agriculture for food security and nutrition.

Green

Rainfed (sustainable) agriculture for food security and nutrition.

Good health & well-being

Blue

Access to safe (domestic) water, sanitation, and hygiene is critical for disease prevention.

Blue

Green

Basic to nutrition.

Quality education

Blue

Water, sanitation, and hygiene are basic to educational opportunities, particularly for girls.

Gender equality

Blue

Green

Current water governance is biased against women and girls.

Clean water & sanitation

Blue

Safe drinking water, sanitation, and hygiene. Women are raped when fetching water and engaging in open defecation.

Green

Poor sewage management affects soil and green water.

Affordable & clean energy

Blue

Green

Energy needs water (e.g., cooling, dams, cleaning solar panels), and water needs energy (e.g., treatment/distribution).

Decent work & economic growth

Blue

Green

Supporting livelihoods from farming to advanced manufacturing.

Industry, innovation & infrastructure

Blue

Green

Water footprint of companies and their environmental discharge into water systems (e.g., polyfluoroalkyl substances).

(De)Centralised and infrastructure models for access and conservation.

Natural green-blue-grey infrastructure solutions.

Reduced inequalities

Blue

Green

Inequalities in water distribution exacerbates income inequality. Income inequality can encourage land- and water-grabbing.

Water pricing and universal and affordable access.

Sustainable cities & communities

Blue

Sustainable urban water management (e.g., universal clean drinking water and sanitation and stormwater management).

Responsible consumption & production

Blue

Green

High income/revenue individuals and organisations use excessive water in Scope 1, Scope 2, and Scope 3.

Corporate water footprint.

Supply chain water footprint.

Climate action

Blue

Climate change influences water, and water influences climate change (water vapour).

Green

Stable green water stocks are essential for carbon sequestration.

Life below water

Blue

Aquatic ecosystem functioning.

Life on land

Green

Terrestrial/biosphere ecosystem functioning.

Peace, justice & strong institutions

Blue

Water is closely related to conflict and civil war. Strong institutions for water management can enhance human health and peace (Gupta et al., 2024).

Managing the hydrological cycle as a global common good therefore calls for collective, systemic, and economy-wide action. Without equitably engaging more communities and countries in governing water collectively as a system, countries will fail to ensure its stability. For example, existing water governance structures have little or no influence on how land is used or how different technologies that require water evolve – much less on global markets and financial flows. The water community alone cannot solve the world’s water problems at any scale. All stakeholders need to become much more aware of “how water works” and what is needed to address water challenges. There will be lessons from the climate change and biodiversity communities about how this process of socialisation of complex concepts has been carried out. All sectors, cultures, communities, and countries need to be engaged.

If governance systems can tap into the collective intelligence and resources of different actors, then countries and regions can develop more effective solutions, learning from one another and innovating together. It will not be easy: there are large disparities in wealth and political power across and within countries, as well as in the distribution of benefits and negative impacts, so the interests of stakeholders often conflict (Meta, 2003; Desai, 2003).

Agreeing to govern the hydrological cycle as a global common good has profound implications for how to do this in practice, including the remits and mandates of economic actors – from governments to business and civil society – and the design of policies, institutions, and relationships to ensure that justice is at the centre of the response. It begins by recognising that governments have an important role in proactively shaping markets for water across the economy, not just reactively fixing them.

The global water crisis, as updated here, combined with the scientific assessment of rapidly changing and increasingly unreliable freshwater resources across the entire world, calls for adjustments in the economic concepts we apply to water. First, acknowledging that blue and green water systems, though partly renewable, are finite. This implies that there are absolute limits, and thus finite budgets, to the amount of water that can be safely and sustainably consumed. For blue water, this implies that there are limits on the amount of water that can be withdrawn and limits on the concentration of pollutants. For green water, protecting the sources of supply (e.g., forests, wetlands) and integrated policies to conserve the moisture held in soils will be critical. Second, we must value water for the essential services it provides. Managing water stresses will require discouraging waste, allocating scarce water resources between sectors to obtain greater benefits, and ensuring sufficient water for ecosystems.

References

Avissar, R., & Werth, D. (2005). “Global Hydroclimatological Teleconnections Resulting from Tropical Deforestation”. J. Hydrometeor., 6. https://doi.org/10.1175/JHM406.1.

Caretta, M.A. et al. (2022). “Water” in Climate Change 2022: Impacts, Adaptation and Vulnerability. Contribution of Working Group II to the Sixth Assessment Report of the Intergovernmental Panel on Climate Change. Cambridge University Press. doi: 10.1017/9781009325844.006.

Damania, R. et al. (2019). Quality Unknown: The Invisible Water Crisis. The World Bank. http://hdl.handle.net/10986/32245.

Dasgupta, P. (2021). The Economics of Biodiversity: The Dasgupta Review. HM Treasury, London.

De Petrillo, E. et al. (2024). Reconciling Tracked Atmospheric Water Flows to Close the Global Freshwater Cycle. doi: 10.21203/rs.3.rs-4177311/v1.

Douville, H. et al. (2021). “Water Cycle Changes” in Climate Change 2021: The Physical Science Basis. Contribution of Working Group I to the Sixth Assessment Report of the Intergovernmental Panel on Climate Change. Cambridge University Press. doi: 10.1017/9781009157896.001.

EC (2022). Proposal for a Directive of the European Parliament and of the Council Concerning Urban Wastewater Treatment. European Commission.

Falkenmark, M. (1989). The massive water scarcity now threatening Africa: Why isn’t it being addressed? Ambio. https://www.jstor.org/stable/4313541.

Falkenmark, M. & Molden, D. (2008). “Wake Up to Realities of River Basin Closure”. International Journal of Water Resources Development, 24(2). https://doi.org/10.1080/07900620701723570.

Fan, Y. et al. (2013). Global Patterns of Groundwater Table Depth. Science. Doi: 10.1126/science.1229881.

Friedlingstein, P. et al. (2023). “Global Carbon Budget 2023”. Earth System Science Data, 15(12). https://doi.org/10.5194/essd-15-5301-2023.

Frieler, K. et al. (2024). “Scenario setup and forcing data for impact model evaluation and impact attribution within the third round of the Inter-Sectoral Impact Model Intercomparison Project (ISIMIP3a)”. Geoscientific Model Development, 17(1), 1–51. https://doi.org/10.5194/gmd-17-1-2024.

GCEW (2023). The What, Why and How of the World Water Crisis: Global Commission on the Economics of Water Phase 1 Review and Findings. Global Commission on the Economics of Water. https://watercommission.org/wp-content/uploads/2023/03/Why-What-How-of-Water-Crisis-Web.pdf.

Gleeson, T. et al. (2020). “Illuminating water cycle modifications and Earth system resilience in the Anthropocene”. Water Resources Research, 56(4). https://doi.org/10.1029/2019WR024957.

Güntner, A. (n.d.). The Earth’s Total Global Water Storage. Accessed June 14, 2024. https://www.globalwaterstorage.info/en/anwendungen/terrestrial-water-storage.

Gupta, J. et al. (2024). SDG 16 and water (re)allocation: Promoting the rule of law for water justice. https://sdgs.un.org/sites/default/files/2024-05/Gupta_SDG%2016%20and%20Water%20%28re%29allocation.pdf.

Gupta, J.  et al. (2023). “Earth system justice needed to identify and live within Earth system boundaries”. Nature Sustainability, 6(6). https://doi.org/10.1038/s41893-023-01064-1.

Hasan, M.F. et al. (2023). “Global Land Subsidence Mapping Reveals Widespread Loss of Aquifer Storage Capacity.” Nature Communications 14 (1). doi: 10.1038/s41467-023-41933-z.

Jones, E. et al. (2024). “Current and future global water scarcity intensifies when accounting for surface water quality”. Nature Climate Change. doi: 10.1038/s41558-024-02007-0.

Keys, P. W. et al. (2012). “Analyzing precipitationsheds to understand the vulnerability of rainfall dependent regions”. Biogeosciences, 9. https://doi.org/10.5194/bg-9-733-2012.

Kortenkamp, A. et al. (2019). “Mixture risks threaten water quality: the European Collaborative Project SOLUTIONS recommends changes to the WFD and better coordination across all pieces of European chemicals legislation to improve protection from exposure of the aquatic environment to multiple pollutants”. Environmental Sciences Europe, 31(1). doi: 10.1186/s12302-019-0245-6.

Mazzucato, M.  et al. (2023), Turning the Tide: A Call to Collective Action. Global Commission on the Economics of Water. Paris.

Molle, F. et al. (2010). “River basin closure: Processes, implications and responses”. Agricultural Water Management, 97(4). https://doi.org/10.1016/j.agwat.2009.01.004.

Nabuurs, G. J. et al. (2023). “Agriculture, Forestry and Other Land Uses (AFOLU)” in Climate Change 2022: Mitigation of Climate Change. Contribution of Working Group III to the Sixth Assessment Report of the Intergovernmental Panel on Climate Change. Cambridge University Press. https://doi.org/10.1017/9781009157926.009.

Porkka, M.  et al. (2024). “Notable shifts beyond pre-industrial streamflow and soil moisture conditions transgress the planetary boundary for freshwater change”. Nature Water, 2(3). https://doi.org/10.1038/s44221-024-00208-7.

Ramsar Convention Secretariat (2018). Global Wetland Outlook: State of the World’s Wetlands and their Services to People. Ramsar Convention on Wetlands.

Renaldi, A. (2023). The Sea Is Swallowing Us Whole: How Sinking Land, Rising Sea Level Threaten Semarang Laborers. Pulitzer Center. https://pulitzercenter.org/stories/sea-swallowing-us-whole-how-sinking-land-rising-sea-level-threaten-semarang-laborers.

Richardson, K. et al. (2023). “Earth beyond six of nine planetary boundaries”. Science Advances, 9(37). https://doi.org/10.1126/sciadv.adh2458.

Rockström, J. et al. (2023). “Safe and just Earth system boundaries”. Nature. https://doi.org/10.1038/s41586-023-06083-8.

Rockström, J. et al. (2009). Future water availability for global food production: The potential of green water for increasing resilience to global change. Water Resources Research, 45(7). https://doi.org/10.1029/2007WR006767.

Rockström, J. et al. (2014). Water Resilience for Human Prosperity. Cambridge: Cambridge University Press.

Rodell, M. et al. (2018). Emerging trends in global freshwater availability. Nature. https://doi.org/10.1038/s41586-018-0123-1.

Rodella, A.-S. et al. (eds.) (2023). The Hidden Wealth of Nations: The Economics of Groundwater in Times of Climate Change. The World Bank. http://hdl.handle.net/10986/39917.

Russ, J. et al. (2022). “The impact of water quality on GDP growth: Evidence from around the world”. Water Security, 17. doi: 10.1016/j.wasec.2022.100130.

SCCRWP (2014). Development of bioanalytical techniques for monitoring constituents/chemicals of emerging concern (CECs) in recycled water applications for the state of California. California Water Boards.

Smith, C. et al. (2023). “Tropical Deforestation Causes Large Reductions in Observed Precipitation.” Nature 615(7951). doi: 10.1038/s41586-022-05690-1.

Steffen, W. et al. (2015). “Planetary boundaries: Guiding human development on a changing planet”. Science, 347(6223). https://doi.org/10.1126/science.1259855.

Stewart-Koster, B. et al. (2023). “Living within the safe and just Earth system boundaries for blue water”. Nature Sustainability. https://doi.org/10.1038/s41893-023-01247-w.

Tebaldi, C. et al. (2021). “Climate model projections from the Scenario Model Intercomparison Project (ScenarioMIP) of CMIP6”. Earth System Dynamics, 12(1) . https://doi.org/10.5194/esd-12-253-2021.

Tuinenburg, O. A., & Staal, A. (2020). “Tracking the global flows of atmospheric moisture and associated uncertainties”. Hydrology and Earth System Sciences, 24(5). https://doi.org/10.5194/hess-24-2419-2020.

van der Ent, R. J. et al. (2014). “Contrasting roles of interception and transpiration in the hydrological cycle – Part 2: Moisture recycling”. Earth System Dynamics, 5(2). https://doi.org/10.5194/esd-5-471-2014.

van der Ent, R. J. et al. (2010). Origin and fate of atmospheric moisture over continents. Water Resources Research. https://doi.org/10.1029/2010WR009127.

Wang, M. et al. (2024). “A triple increase in global river basins with water scarcity due to future pollution”. Nature Communications, 15(1). doi: 10.1038/s41467-024-44947-3.

Wang-Erlandsson, L. et al. (2022). “A planetary boundary for green water”. Nature Reviews Earth & Environment, 3(6). https://doi.org/10.1038/s43017-022-00287-8.

Werth, D., and Avissar R. (2002). “The local and global effects of Amazon deforestation”. J. Geophys. Res., 107. doi: 10.1029/2001JD000717.